The State of SSL/TLS
We use GeoTrust SSL Monitor to analyze the security of the world's 1,000,000 most-visited websites every month.
What changed since the previous run
The population each month is the top 1,000,000 websites as of that run; movers compare cohort slices across runs, not a fixed set of websites.
Not affected by the filter above.Biggest movers since 2026-09
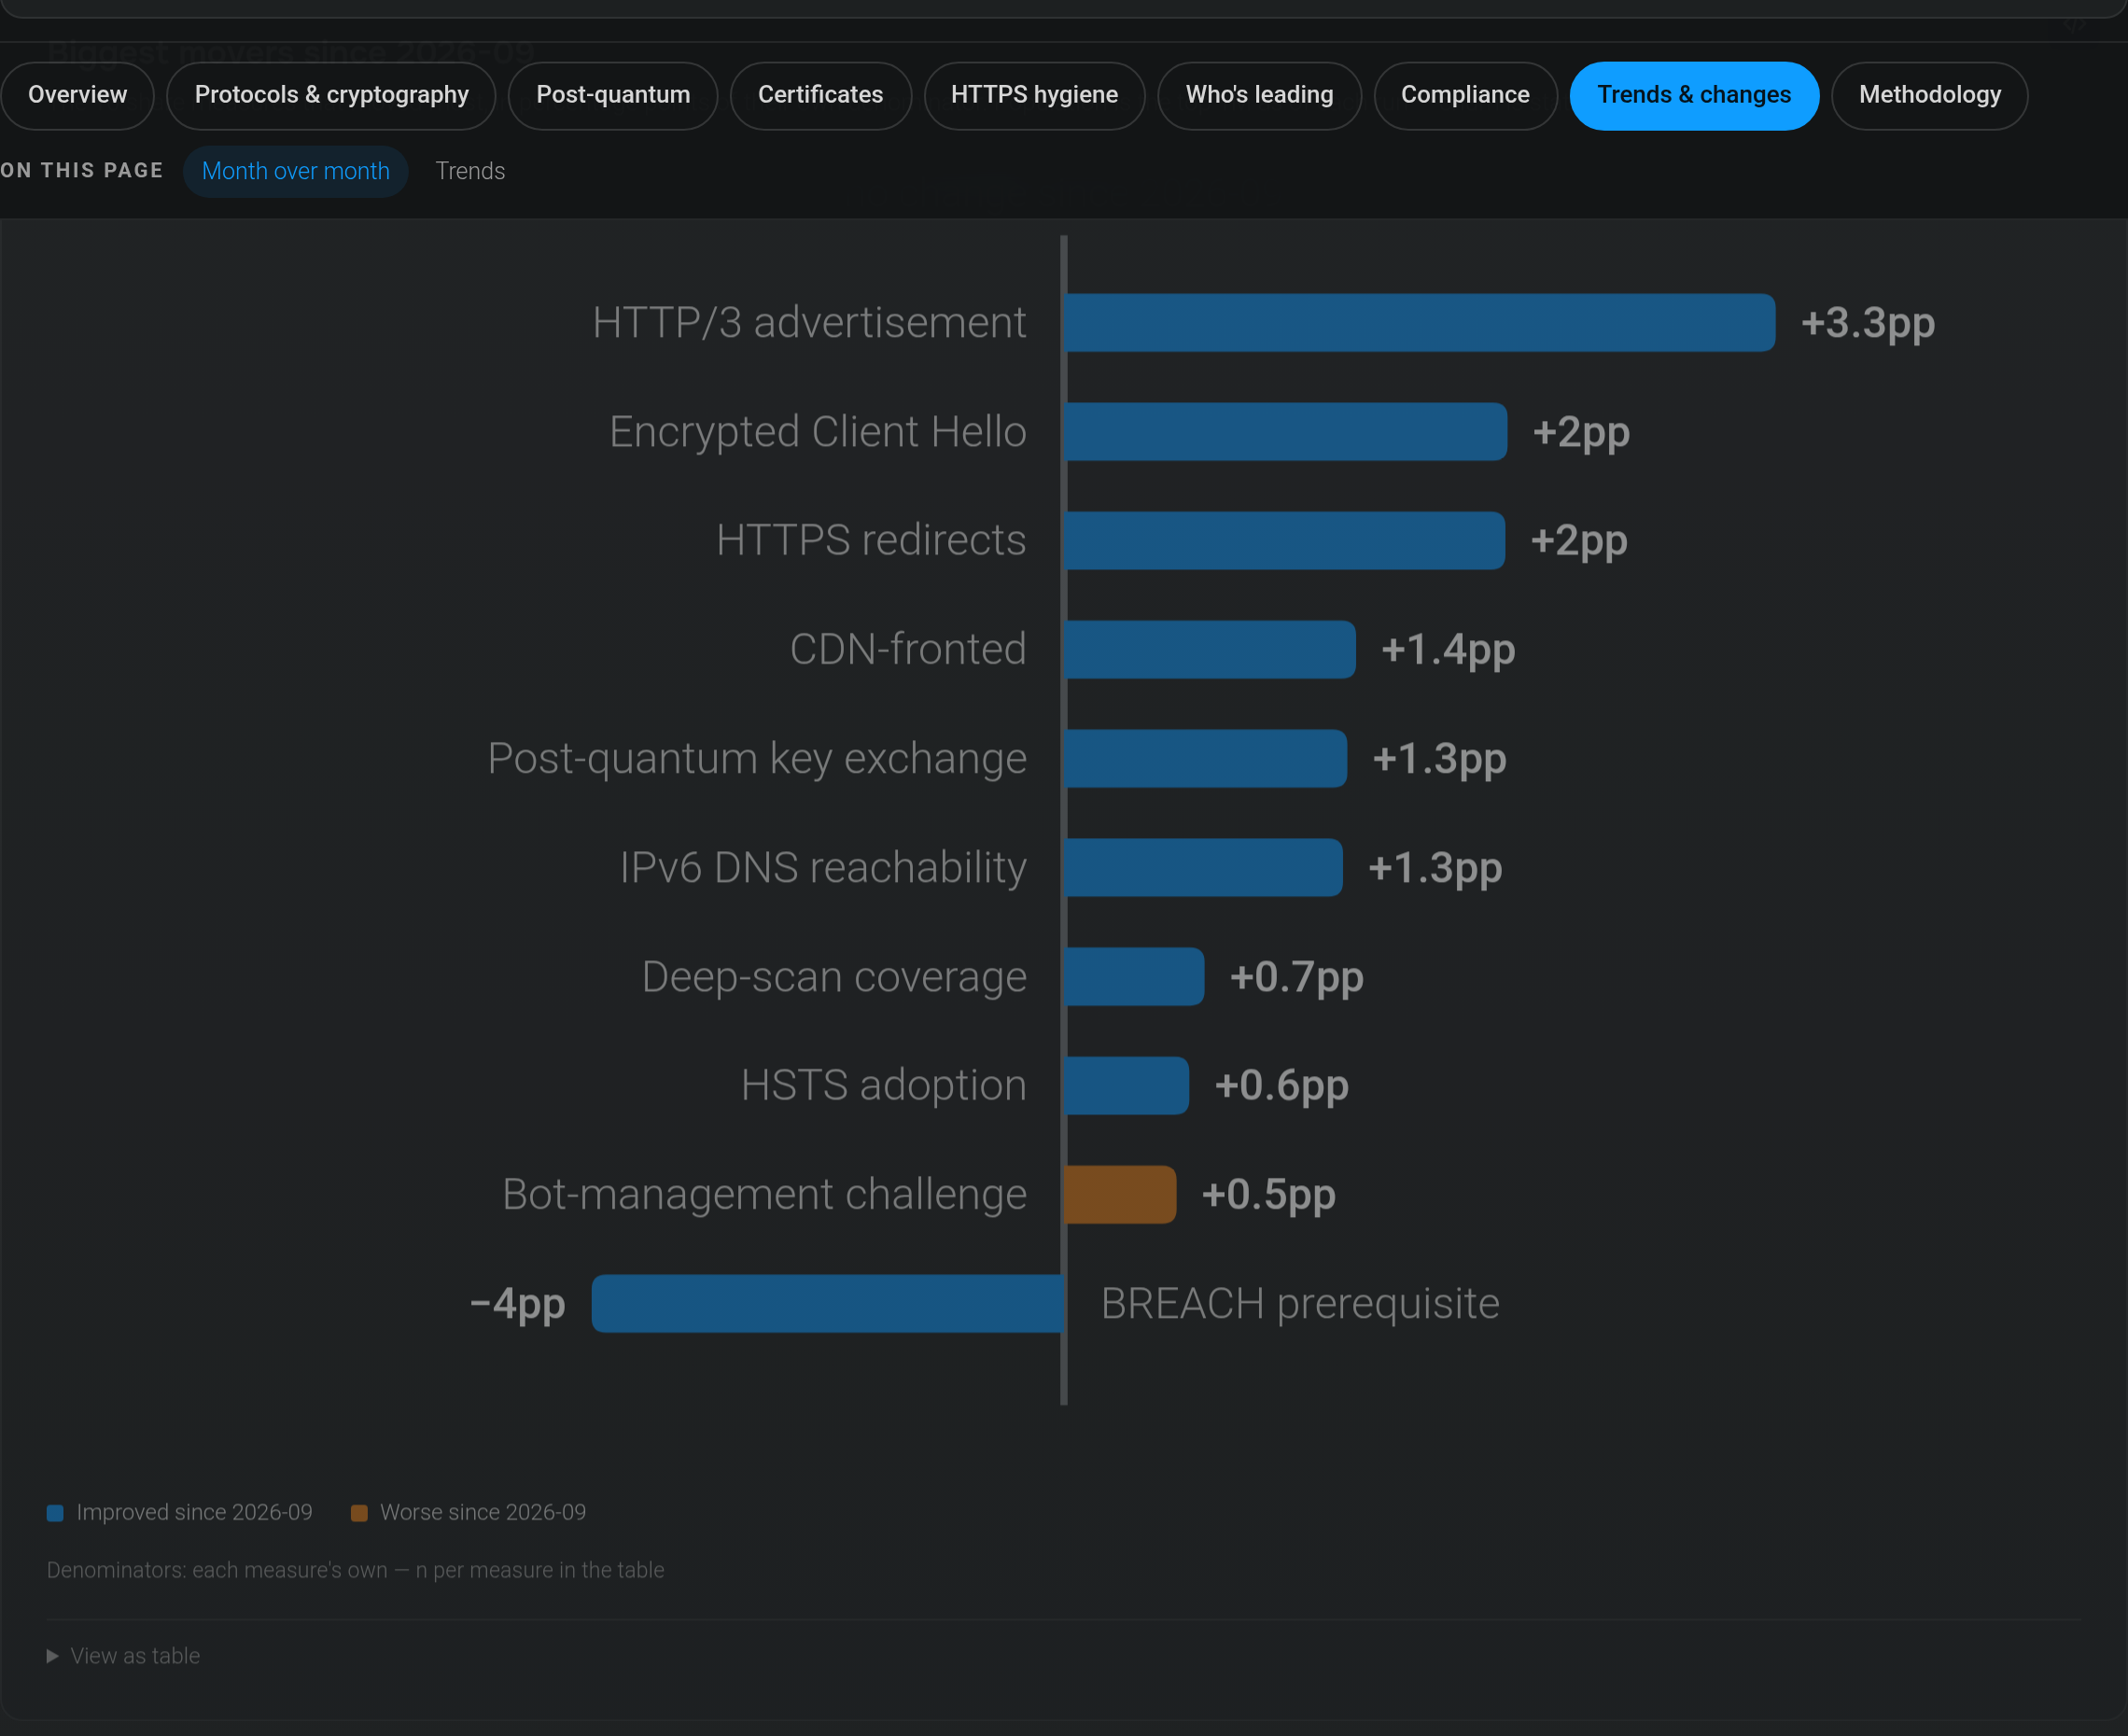
The 10 share measures that moved most, in percentage points of their own denominator. Population is the top 1M as of each run — churn is stated in the methodology.
Denominators: each measure's own — n per measure in the table
View as table
| Measure | Change since 2026-09 | Now | n |
|---|---|---|---|
| BREACH prerequisite | −4pp | 73.2% | 973,443 |
| HTTP/3 advertisement | +3.3pp | 45.2% | 973,443 |
| Encrypted Client Hello | +2pp | 23.8% | 973,443 |
| HTTPS redirects | +2pp | 78.6% | 1,000,000 |
| CDN-fronted | +1.4pp | 51.1% | 1,000,000 |
| Post-quantum key exchange | +1.3pp | 61.3% | 973,443 |
| IPv6 DNS reachability | +1.3pp | 40.7% | 1,000,000 |
| Deep-scan coverage | +0.7pp | 99.9% | 974,775 |
| HSTS adoption | +0.6pp | 34.4% | 1,000,000 |
| Bot-management challenge | +0.5pp | 9.8% | 1,000,000 |
TLS 1.3 movers by industry
Percentage-point change per industry since the previous run.
Denominator: deep-scanned websites · n per cohort in the table
Adult moved most: +2.8pp on tls 1.3 adoption since 2026-09 (overall +0.3pp).
View as table
| industry | Change since 2026-09 | Now | n |
|---|---|---|---|
| Adult | +2.8pp | 84.9% | 24,896 |
| Education | +0.5pp | 87.3% | 102,144 |
| Cloud & Infrastructure | +0.4pp | 86.4% | 53,547 |
| Telecom | +0.4pp | 82.7% | 7,186 |
| Government | +0.4pp | 81.8% | 21,993 |
| News & Publishing | +0.3pp | 90.6% | 34,566 |
| Travel & Local | +0.3pp | 90% | 58,262 |
| Gaming & Gambling | +0.3pp | 93.4% | 89,940 |
| Media & Social | +0.3pp | 91.3% | 120,103 |
| Software & Internet | +0.2pp | 88% | 221,143 |
| Healthcare | +0.2pp | 89.5% | 42,655 |
| Finance | +0.1pp | 89.1% | 34,241 |
| E-commerce & Retail | +0pp | 92.1% | 151,478 |
| Other | −0.9pp | 87.7% | 11,289 |

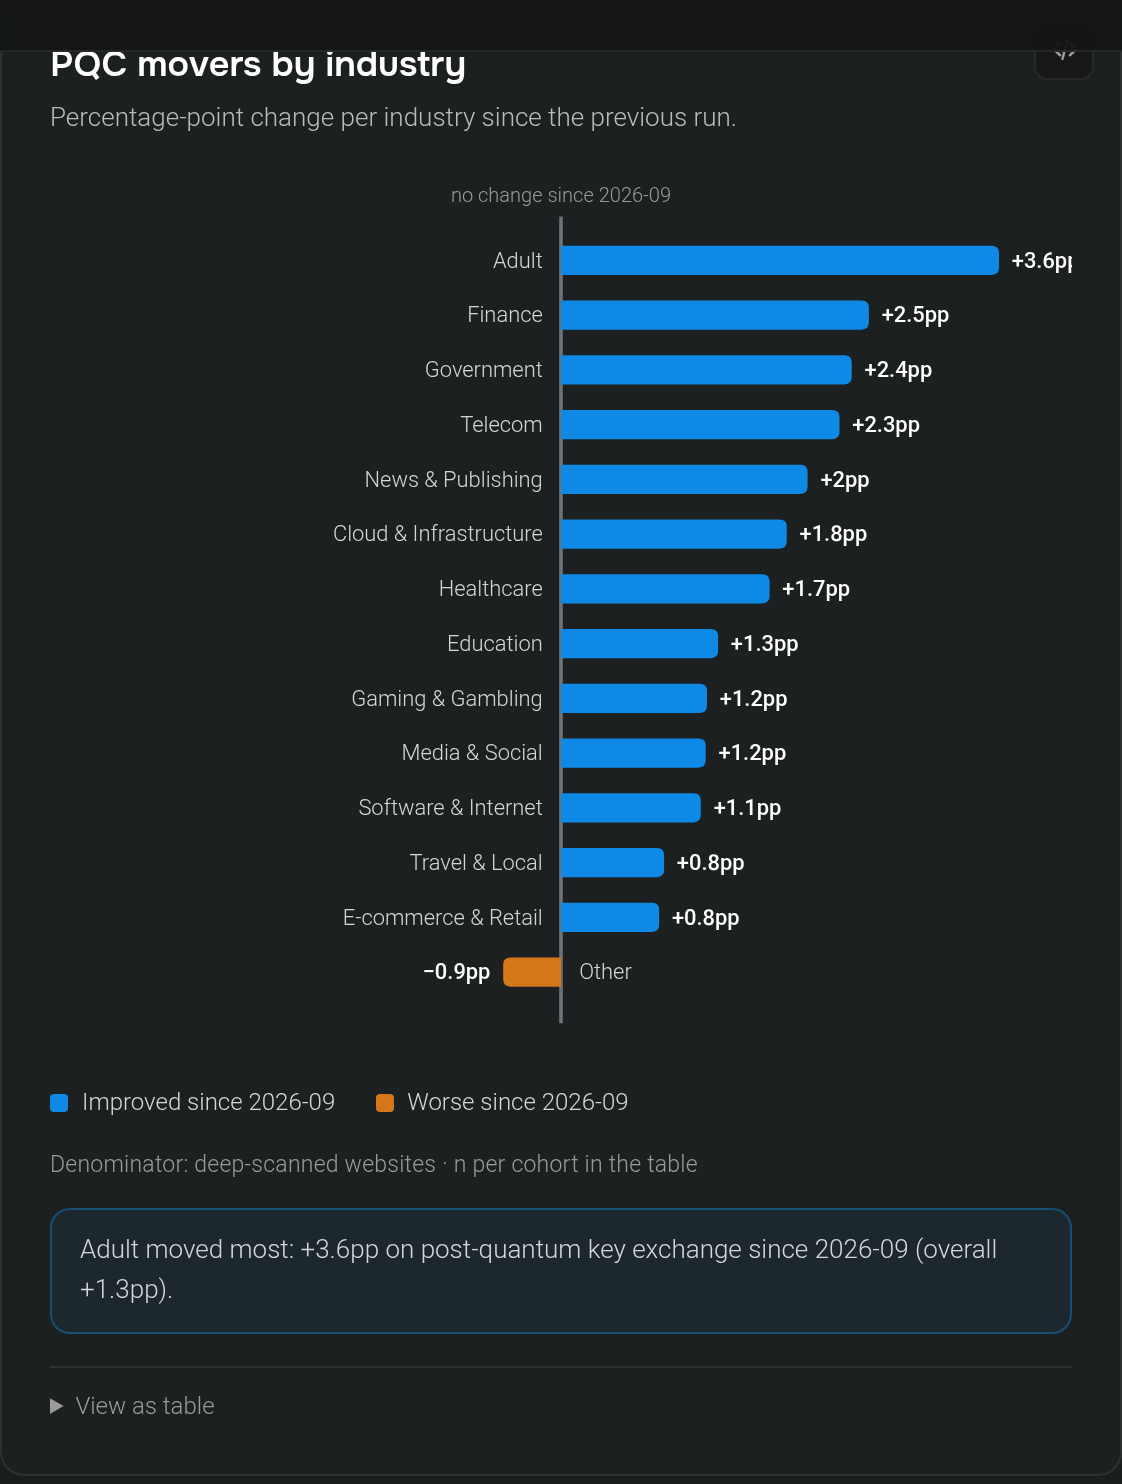
PQC movers by industry
Percentage-point change per industry since the previous run.
Denominator: deep-scanned websites · n per cohort in the table
Adult moved most: +3.6pp on post-quantum key exchange since 2026-09 (overall +1.3pp).
View as table
| industry | Change since 2026-09 | Now | n |
|---|---|---|---|
| Adult | +3.6pp | 66.7% | 24,896 |
| Finance | +2.5pp | 61.4% | 34,241 |
| Government | +2.4pp | 41.1% | 21,993 |
| Telecom | +2.3pp | 38.6% | 7,186 |
| News & Publishing | +2pp | 62.9% | 34,566 |
| Cloud & Infrastructure | +1.9pp | 49.4% | 53,547 |
| Healthcare | +1.7pp | 59.7% | 42,655 |
| Education | +1.3pp | 50.6% | 102,144 |
| Gaming & Gambling | +1.2pp | 81.2% | 89,940 |
| Media & Social | +1.2pp | 67% | 120,103 |
| Software & Internet | +1.1pp | 57.2% | 221,143 |
| Travel & Local | +0.8pp | 57.1% | 58,262 |
| E-commerce & Retail | +0.8pp | 67.6% | 151,478 |
| Other | −1pp | 57.2% | 11,289 |
Adoption over time
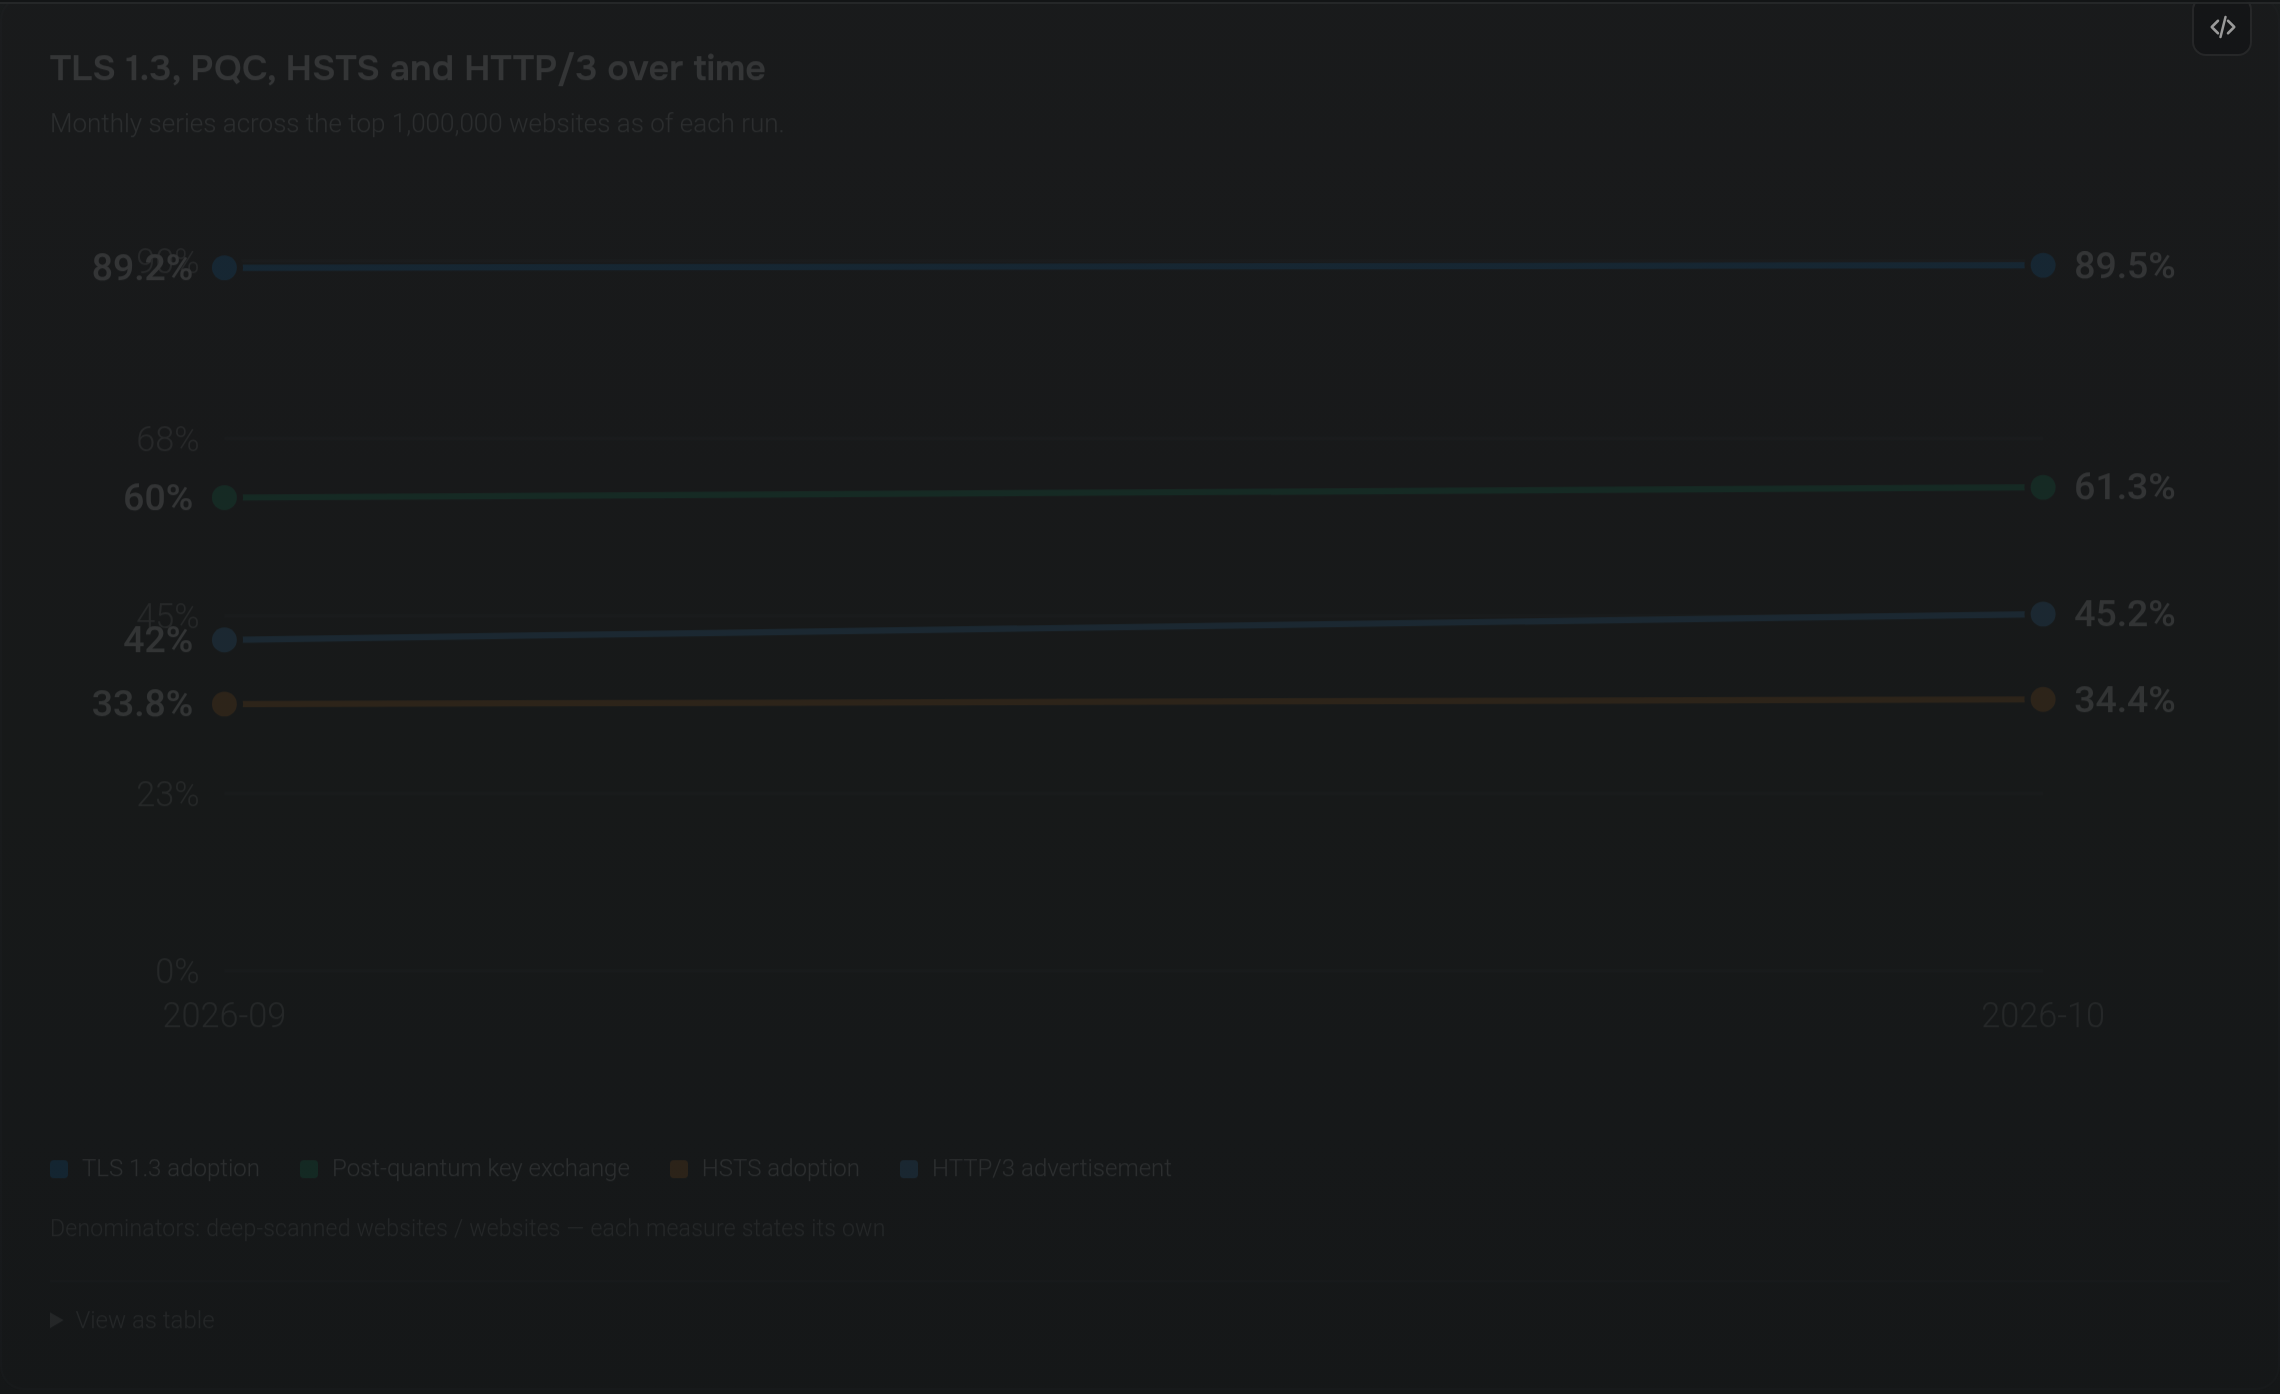
Not affected by the filter above.TLS 1.3, PQC, HSTS and HTTP/3 over time
Monthly series across the top 1,000,000 websites as of each run.
Denominators: deep-scanned websites / websites — each measure states its own
View as table
| Run | TLS 1.3 adoption | Post-quantum key exchange | HSTS adoption | HTTP/3 advertisement |
|---|---|---|---|---|
| 2026-09 | 89.2% | 60% | 33.8% | 42% |
| 2026-10 | 89.5% | 61.3% | 34.4% | 45.2% |
Legacy protocols over time
TLS 1.0, TLS 1.1 and SSLv3 offered by deep-scanned websites.
Denominator: deep-scanned websites · n = 973,443
View as table
| Run | TLS 1.0 offering | TLS 1.1 offering | SSLv3 offering |
|---|---|---|---|
| 2026-09 | 34.8% | 36.3% | 0.4% |
| 2026-10 | 34.9% | 36.5% | 0.4% |

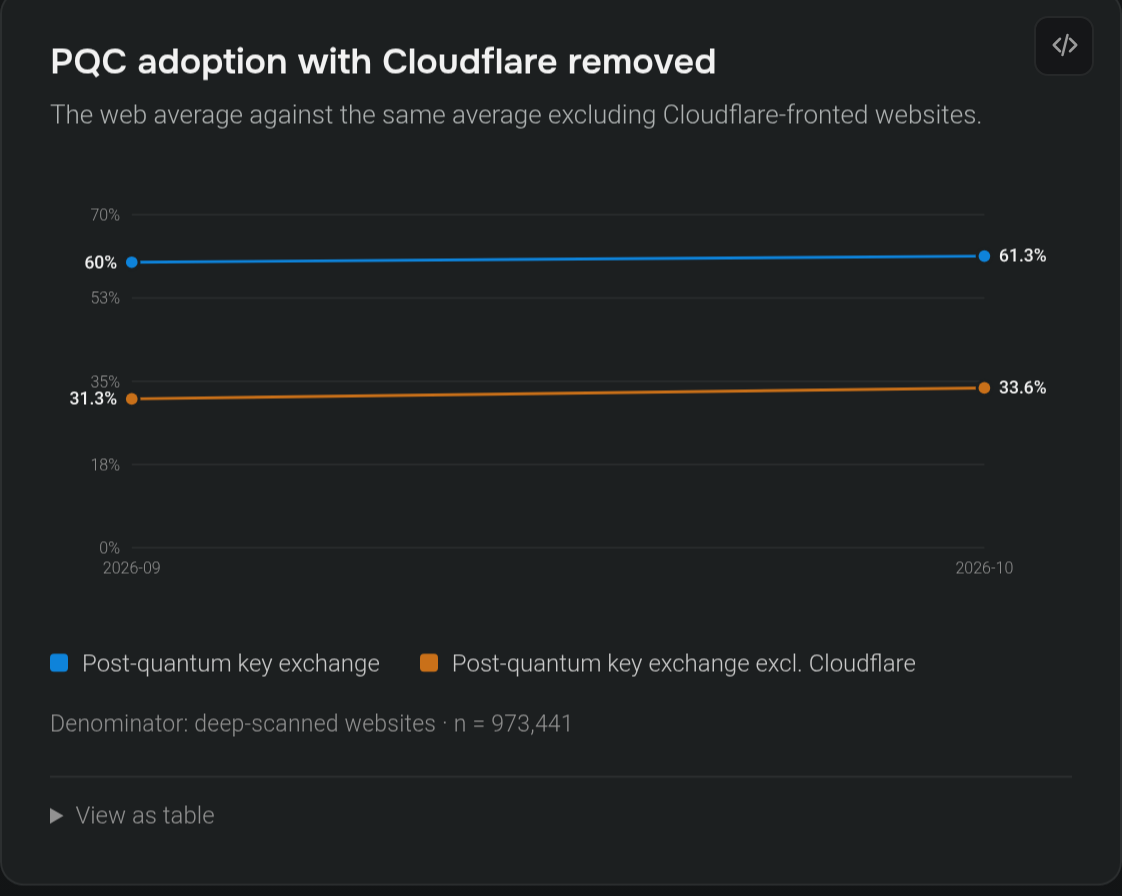
PQC adoption with Cloudflare removed
The web average against the same average excluding Cloudflare-fronted websites.
Denominator: deep-scanned websites · n = 973,443
View as table
| Run | Post-quantum key exchange | Post-quantum key exchange excl. Cloudflare |
|---|---|---|
| 2026-09 | 60% | 31.3% |
| 2026-10 | 61.3% | 33.6% |