Celebrating 27 Years

Celebrating 27 Years – Announcing the new GeoTrust Horizon® platform. Learn More

GEOTRUST RESEARCH · OCTOBER 2026 CRAWL

The State of SSL/TLS

We use GeoTrust SSL Monitor to analyze the security of the world's 1,000,000 most-visited websites every month.

INDUSTRY
  • All industries1,000,000
  • Adult25,228
  • Cloud & Infrastructure53,765
  • E-commerce & Retail153,653
  • Education104,410
  • Finance34,954
  • Gaming & Gambling91,111
  • Government22,435
  • Healthcare43,313
  • Media & Social122,636
  • News & Publishing34,974
  • Software & Internet234,491
  • Telecom7,357
  • Travel & Local59,033
  • Other12,640
REGION
  • All regions1,000,000
  • North America151,778
  • South America36,167
  • Europe261,584
  • Asia180,131
  • Middle East23,630
  • Africa11,295
  • Oceania14,127
  • Unknown321,277
RANK
  • All ranks1,000,000
  • top 1k781
  • 1k–10k7,514
  • 10k–100k77,557
  • 100k+914,148

Showing 1,000,000 of 1,000,000 websites

Operational controls

Modern HTTPS hygiene

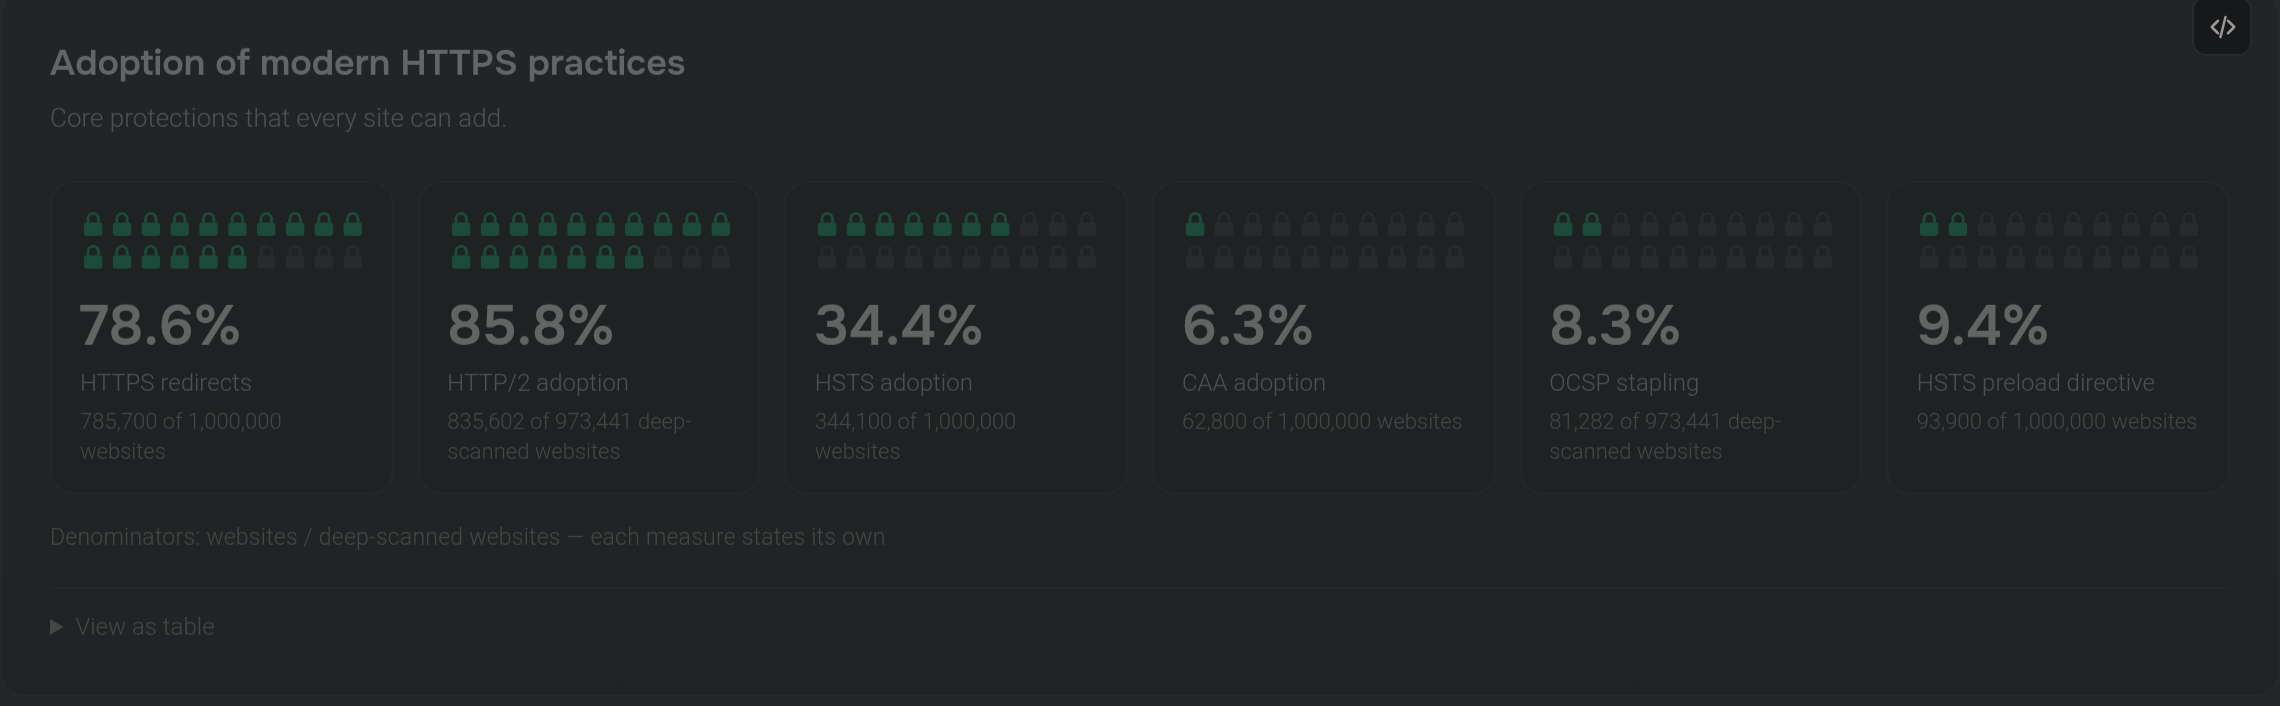
Adoption of modern HTTPS practices

Core protections that every site can add.

HTTPS redirects: 78.6% HTTPS redirects: 78.6% HTTPS redirects: 78.6% HTTPS redirects: 78.6% HTTPS redirects: 78.6% HTTPS redirects: 78.6% HTTPS redirects: 78.6% HTTPS redirects: 78.6% HTTPS redirects: 78.6% HTTPS redirects: 78.6% HTTPS redirects: 78.6% HTTPS redirects: 78.6% HTTPS redirects: 78.6% HTTPS redirects: 78.6% HTTPS redirects: 78.6% HTTPS redirects: 78.6% HTTPS redirects: 78.6% HTTPS redirects: 78.6% HTTPS redirects: 78.6% HTTPS redirects: 78.6% 78.6%HTTPS redirects785,700 of 1,000,000 websites
HTTP/2 adoption: 85.8% HTTP/2 adoption: 85.8% HTTP/2 adoption: 85.8% HTTP/2 adoption: 85.8% HTTP/2 adoption: 85.8% HTTP/2 adoption: 85.8% HTTP/2 adoption: 85.8% HTTP/2 adoption: 85.8% HTTP/2 adoption: 85.8% HTTP/2 adoption: 85.8% HTTP/2 adoption: 85.8% HTTP/2 adoption: 85.8% HTTP/2 adoption: 85.8% HTTP/2 adoption: 85.8% HTTP/2 adoption: 85.8% HTTP/2 adoption: 85.8% HTTP/2 adoption: 85.8% HTTP/2 adoption: 85.8% HTTP/2 adoption: 85.8% HTTP/2 adoption: 85.8% 85.8%HTTP/2 adoption835,603 of 973,443 deep-scanned websites
HSTS adoption: 34.4% HSTS adoption: 34.4% HSTS adoption: 34.4% HSTS adoption: 34.4% HSTS adoption: 34.4% HSTS adoption: 34.4% HSTS adoption: 34.4% HSTS adoption: 34.4% HSTS adoption: 34.4% HSTS adoption: 34.4% HSTS adoption: 34.4% HSTS adoption: 34.4% HSTS adoption: 34.4% HSTS adoption: 34.4% HSTS adoption: 34.4% HSTS adoption: 34.4% HSTS adoption: 34.4% HSTS adoption: 34.4% HSTS adoption: 34.4% HSTS adoption: 34.4% 34.4%HSTS adoption344,100 of 1,000,000 websites
CAA adoption: 6.3% CAA adoption: 6.3% CAA adoption: 6.3% CAA adoption: 6.3% CAA adoption: 6.3% CAA adoption: 6.3% CAA adoption: 6.3% CAA adoption: 6.3% CAA adoption: 6.3% CAA adoption: 6.3% CAA adoption: 6.3% CAA adoption: 6.3% CAA adoption: 6.3% CAA adoption: 6.3% CAA adoption: 6.3% CAA adoption: 6.3% CAA adoption: 6.3% CAA adoption: 6.3% CAA adoption: 6.3% CAA adoption: 6.3% 6.3%CAA adoption62,800 of 1,000,000 websites
OCSP stapling: 8.3% OCSP stapling: 8.3% OCSP stapling: 8.3% OCSP stapling: 8.3% OCSP stapling: 8.3% OCSP stapling: 8.3% OCSP stapling: 8.3% OCSP stapling: 8.3% OCSP stapling: 8.3% OCSP stapling: 8.3% OCSP stapling: 8.3% OCSP stapling: 8.3% OCSP stapling: 8.3% OCSP stapling: 8.3% OCSP stapling: 8.3% OCSP stapling: 8.3% OCSP stapling: 8.3% OCSP stapling: 8.3% OCSP stapling: 8.3% OCSP stapling: 8.3% 8.3%OCSP stapling81,282 of 973,443 deep-scanned websites
HSTS preload directive: 9.4% HSTS preload directive: 9.4% HSTS preload directive: 9.4% HSTS preload directive: 9.4% HSTS preload directive: 9.4% HSTS preload directive: 9.4% HSTS preload directive: 9.4% HSTS preload directive: 9.4% HSTS preload directive: 9.4% HSTS preload directive: 9.4% HSTS preload directive: 9.4% HSTS preload directive: 9.4% HSTS preload directive: 9.4% HSTS preload directive: 9.4% HSTS preload directive: 9.4% HSTS preload directive: 9.4% HSTS preload directive: 9.4% HSTS preload directive: 9.4% HSTS preload directive: 9.4% HSTS preload directive: 9.4% 9.4%HSTS preload directive93,900 of 1,000,000 websites

Denominators: websites / deep-scanned websites — each measure states its own

View as table
MeasureShareSitesn
HTTPS redirects78.6%785,7001,000,000
HTTP/2 adoption85.8%835,603973,443
HSTS adoption34.4%344,1001,000,000
CAA adoption6.3%62,8001,000,000
OCSP stapling8.3%81,282973,443
HSTS preload directive9.4%93,9001,000,000
HSTS

Sending the header vs committing to it

How many sites send an HSTS header vs. how many are preloaded.

Not affected by the filter above.

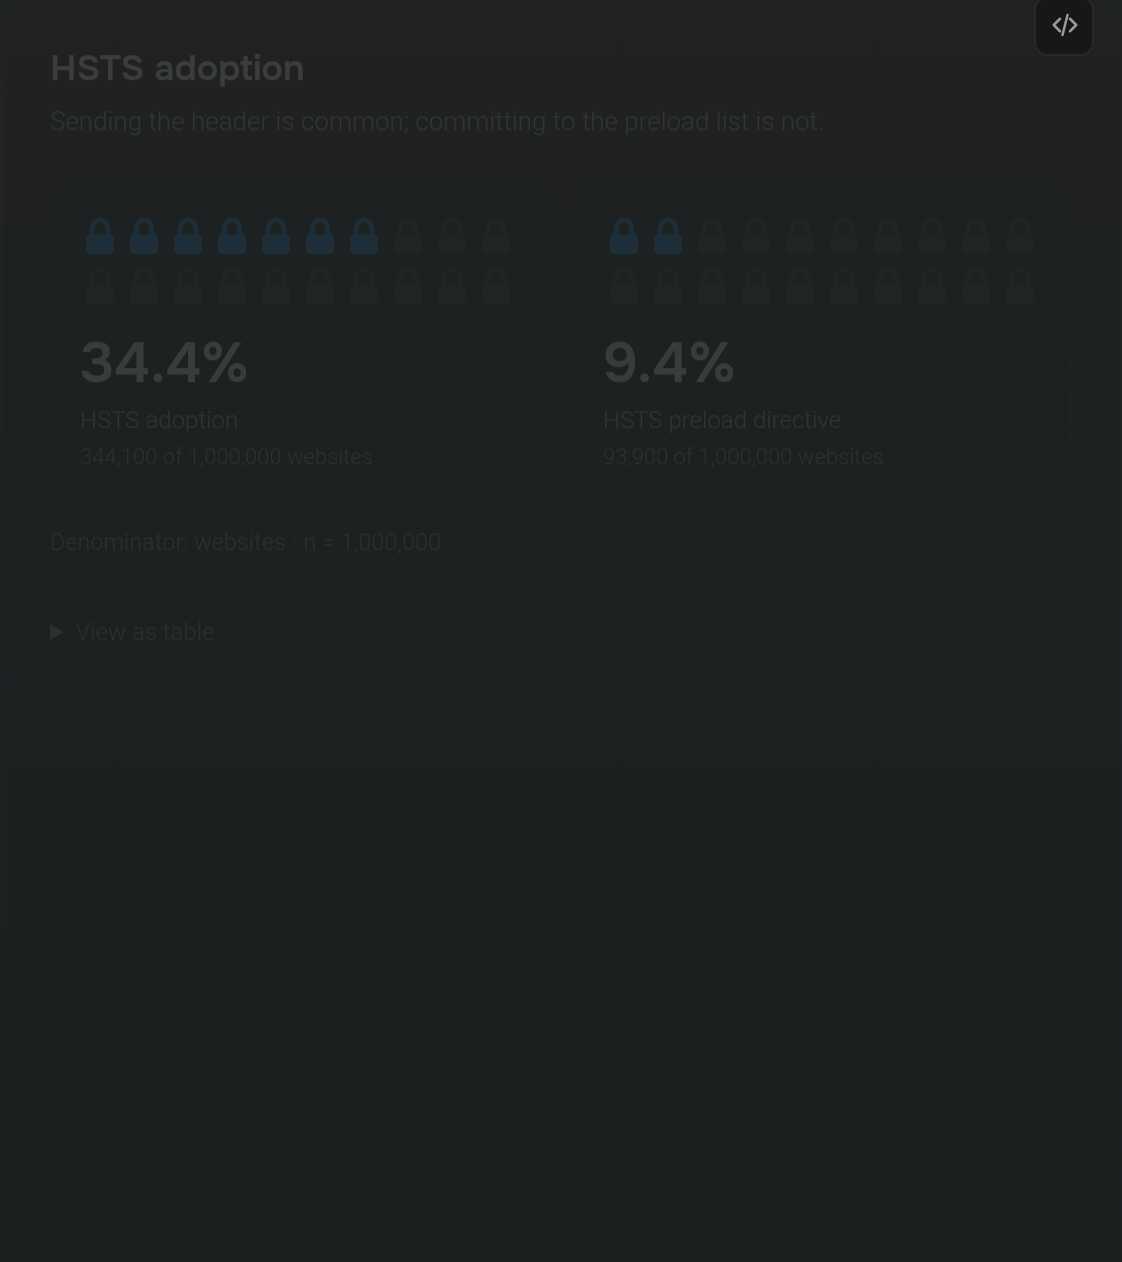
HSTS adoption

Sending the header is common; committing to the preload list is not.

HSTS adoption: 34.4% HSTS adoption: 34.4% HSTS adoption: 34.4% HSTS adoption: 34.4% HSTS adoption: 34.4% HSTS adoption: 34.4% HSTS adoption: 34.4% HSTS adoption: 34.4% HSTS adoption: 34.4% HSTS adoption: 34.4% HSTS adoption: 34.4% HSTS adoption: 34.4% HSTS adoption: 34.4% HSTS adoption: 34.4% HSTS adoption: 34.4% HSTS adoption: 34.4% HSTS adoption: 34.4% HSTS adoption: 34.4% HSTS adoption: 34.4% HSTS adoption: 34.4% 34.4%HSTS adoption344,100 of 1,000,000 websites
HSTS preload directive: 9.4% HSTS preload directive: 9.4% HSTS preload directive: 9.4% HSTS preload directive: 9.4% HSTS preload directive: 9.4% HSTS preload directive: 9.4% HSTS preload directive: 9.4% HSTS preload directive: 9.4% HSTS preload directive: 9.4% HSTS preload directive: 9.4% HSTS preload directive: 9.4% HSTS preload directive: 9.4% HSTS preload directive: 9.4% HSTS preload directive: 9.4% HSTS preload directive: 9.4% HSTS preload directive: 9.4% HSTS preload directive: 9.4% HSTS preload directive: 9.4% HSTS preload directive: 9.4% HSTS preload directive: 9.4% 9.4%HSTS preload directive93,900 of 1,000,000 websites

Denominator: websites · n = 1,000,000

View as table
MeasureShareSitesn
HSTS adoption34.4%344,1001,000,000
HSTS preload directive9.4%93,9001,000,000

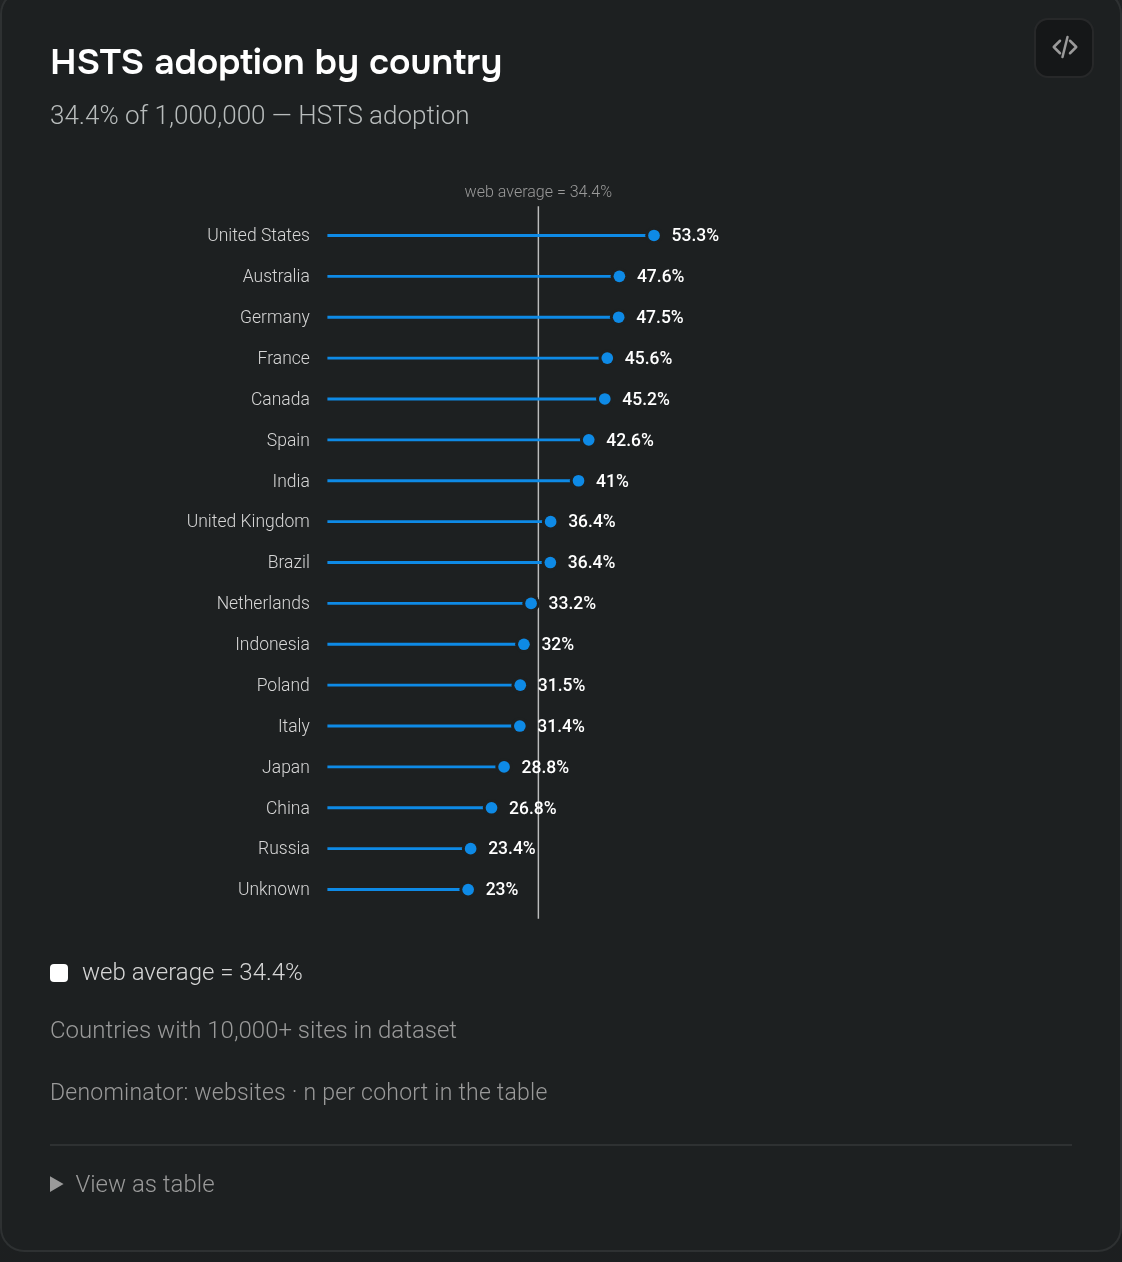
HSTS adoption by country

34.4% of 1,000,000 — HSTS adoption

web average = 34.4%United States: HSTS adoption 53.3%; n=130,259United States53.3%Australia: HSTS adoption 47.6%; n=11,594Australia47.6%Germany: HSTS adoption 47.5%; n=40,426Germany47.5%France: HSTS adoption 45.6%; n=21,184France45.6%Canada: HSTS adoption 45.2%; n=13,890Canada45.2%Spain: HSTS adoption 42.6%; n=13,647Spain42.6%India: HSTS adoption 41%; n=23,441India41%United Kingdom: HSTS adoption 36.4%; n=46,416United Kingdom36.4%Brazil: HSTS adoption 36.4%; n=22,071Brazil36.4%Netherlands: HSTS adoption 33.2%; n=24,699Netherlands33.2%Indonesia: HSTS adoption 32%; n=19,004Indonesia32%Poland: HSTS adoption 31.5%; n=12,411Poland31.5%Italy: HSTS adoption 31.4%; n=17,021Italy31.4%Japan: HSTS adoption 28.8%; n=27,446Japan28.8%China: HSTS adoption 26.8%; n=28,552China26.8%Russia: HSTS adoption 23.3%; n=40,883Russia23.3%Unknown: HSTS adoption 23%; n=324,222Unknown23%
web average = 34.4%

Countries with 10,000+ sites in dataset

Denominator: websites · n per cohort in the table

View as table
CohortSharevs benchmarkn
United States53.3%+18.8pp130,259
Australia47.6%+13.2pp11,594
Germany47.5%+13.1pp40,426
France45.6%+11.2pp21,184
Canada45.2%+10.8pp13,890
Spain42.6%+8.2pp13,647
India41%+6.5pp23,441
United Kingdom36.4%+2pp46,416
Brazil36.4%+2pp22,071
Netherlands33.2%−1.2pp24,699
Indonesia32%−2.4pp19,004
Poland31.5%−2.9pp12,411
Italy31.4%−3pp17,021
Japan28.8%−5.6pp27,446
China26.8%−7.7pp28,552
Russia23.3%−11.1pp40,883
Unknown23%−11.4pp324,222

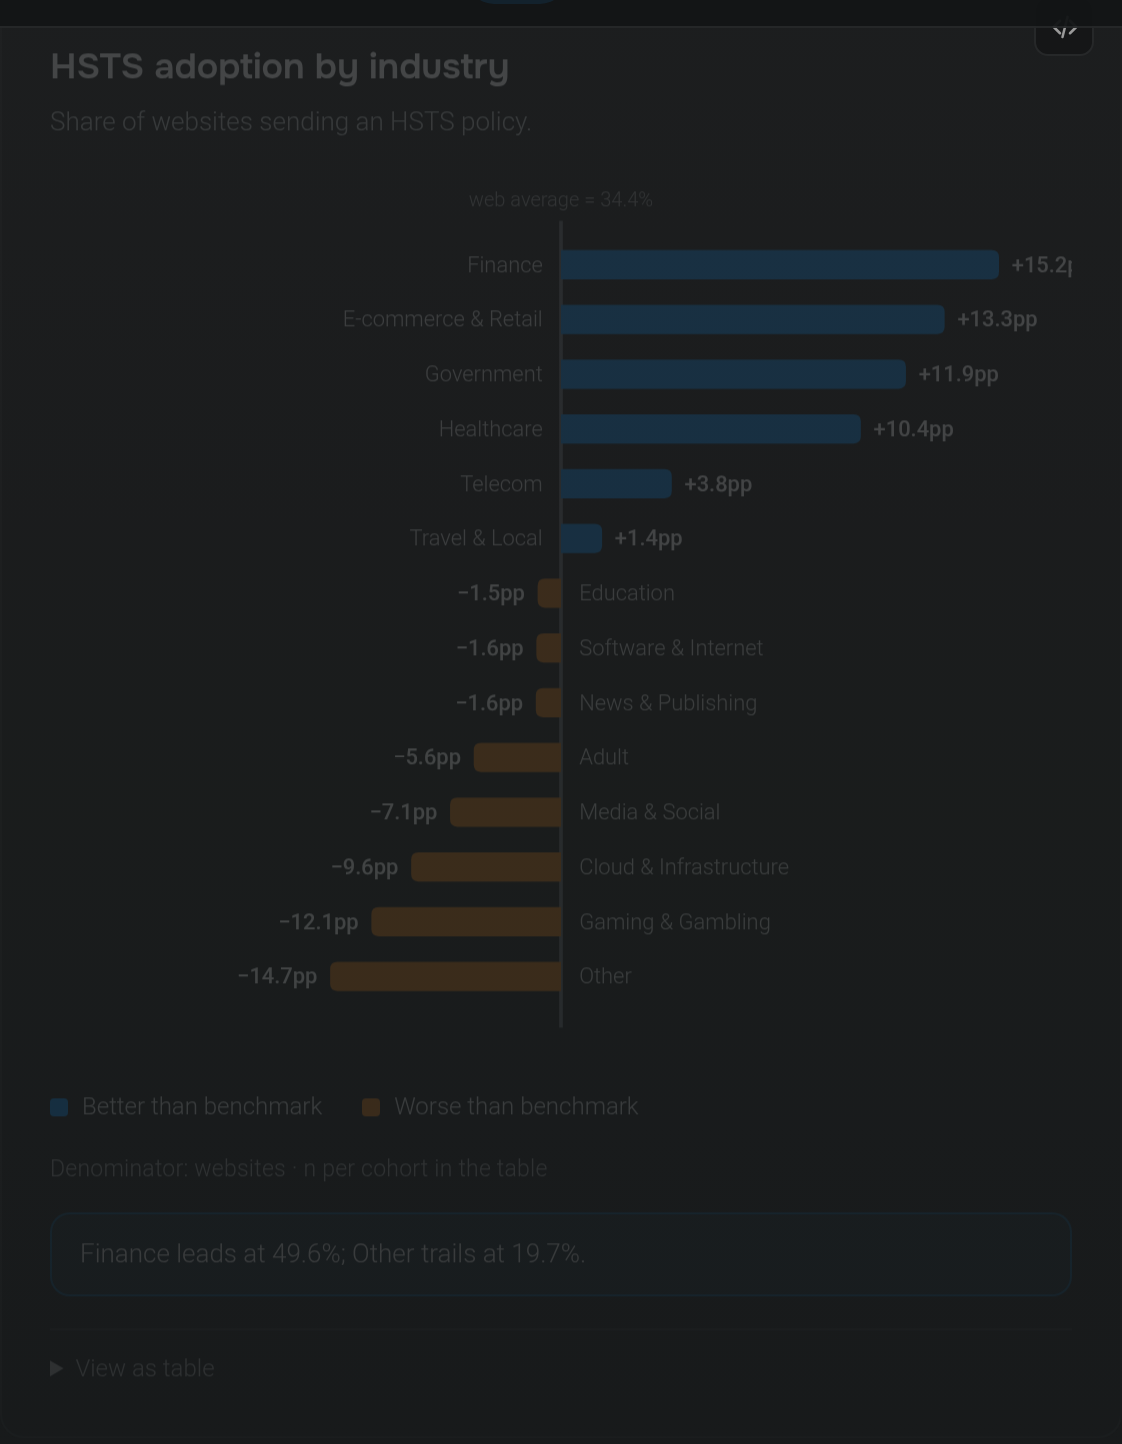
HSTS adoption by industry

Share of websites sending an HSTS policy.

web average = 34.4%Finance: 49.6; +15.2pp vs web average = 34.4% (better); n=34954 Finance +15.2ppE-commerce & Retail: 47.7; +13.3pp vs web average = 34.4% (better); n=153653 E-commerce & Retail +13.3ppGovernment: 46.4; +11.9pp vs web average = 34.4% (better); n=22435 Government +11.9ppHealthcare: 44.8; +10.4pp vs web average = 34.4% (better); n=43313 Healthcare +10.4ppTelecom: 38.3; +3.8pp vs web average = 34.4% (better); n=7357 Telecom +3.8ppTravel & Local: 35.8; +1.4pp vs web average = 34.4% (better); n=59033 Travel & Local +1.4ppEducation: 32.9; −1.5pp vs web average = 34.4% (worse); n=104410 Education −1.5ppSoftware & Internet: 32.8; −1.6pp vs web average = 34.4% (worse); n=234491 Software & Internet −1.6ppNews & Publishing: 32.8; −1.6pp vs web average = 34.4% (worse); n=34974 News & Publishing −1.6ppAdult: 28.8; −5.6pp vs web average = 34.4% (worse); n=25228 Adult −5.6ppMedia & Social: 27.3; −7.1pp vs web average = 34.4% (worse); n=122636 Media & Social −7.1ppCloud & Infrastructure: 24.9; −9.6pp vs web average = 34.4% (worse); n=53765 Cloud & Infrastructure −9.6ppGaming & Gambling: 22.3; −12.1pp vs web average = 34.4% (worse); n=91111 Gaming & Gambling −12.1ppOther: 19.4; −15pp vs web average = 34.4% (worse); n=12640 Other −15pp
Better than benchmarkWorse than benchmark

Denominator: websites · n per cohort in the table

Finance leads at 49.6%; Other trails at 19.4%.

View as table
SliceSharevs benchmarkn
Finance49.6%+15.2pp34,954
E-commerce & Retail47.7%+13.3pp153,653
Government46.4%+11.9pp22,435
Healthcare44.8%+10.4pp43,313
Telecom38.3%+3.8pp7,357
Travel & Local35.8%+1.4pp59,033
Education32.9%−1.5pp104,410
Software & Internet32.8%−1.6pp234,491
News & Publishing32.8%−1.6pp34,974
Adult28.8%−5.6pp25,228
Media & Social27.3%−7.1pp122,636
Cloud & Infrastructure24.9%−9.6pp53,765
Gaming & Gambling22.3%−12.1pp91,111
Other19.4%−15pp12,640

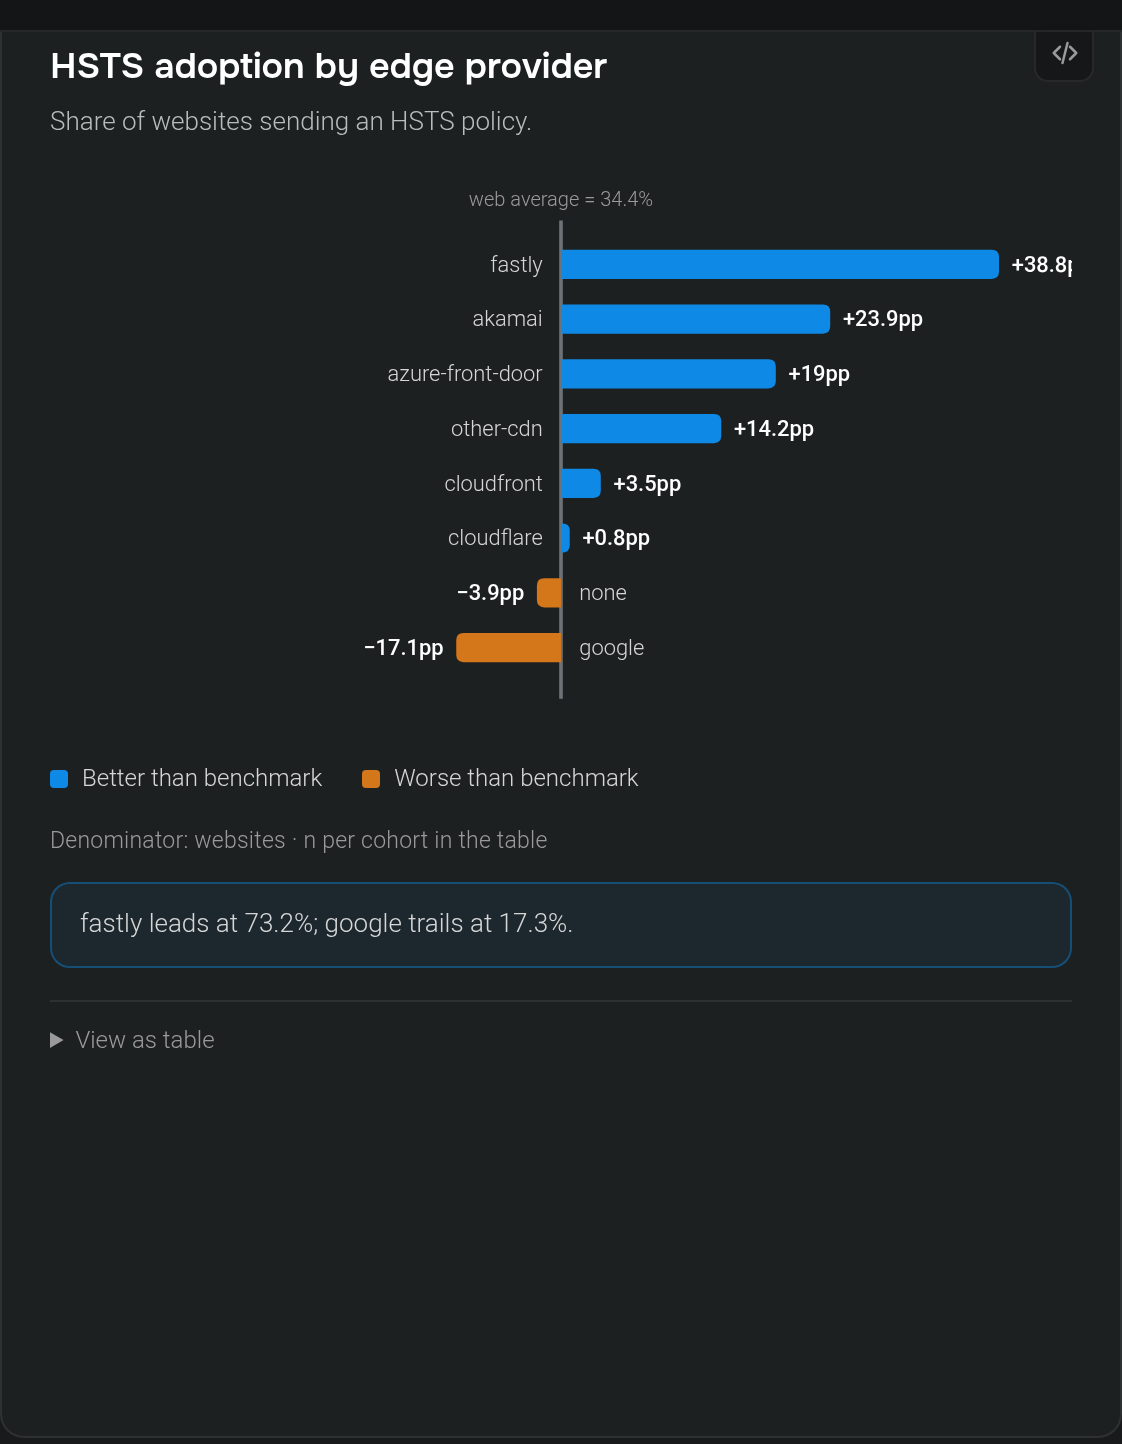
HSTS adoption by edge provider

Share of websites sending an HSTS policy.

web average = 34.4%fastly: 73.2; +38.8pp vs web average = 34.4% (better); n=14984 fastly +38.8ppakamai: 58.3; +23.9pp vs web average = 34.4% (better); n=16020 akamai +23.9ppazure-front-door: 53.4; +19pp vs web average = 34.4% (better); n=14942 azure-front-door +19ppother-cdn: 48.6; +14.2pp vs web average = 34.4% (better); n=31639 other-cdn +14.2ppcloudfront: 37.9; +3.5pp vs web average = 34.4% (better); n=5921 cloudfront +3.5ppcloudflare: 35.2; +0.8pp vs web average = 34.4% (better); n=420719 cloudflare +0.8ppnone: 30.5; −3.9pp vs web average = 34.4% (worse); n=488814 none −3.9ppgoogle: 17.3; −17.1pp vs web average = 34.4% (worse); n=6961 google −17.1pp
Better than benchmarkWorse than benchmark

Denominator: websites · n per cohort in the table

fastly leads at 73.2%; google trails at 17.3%.

View as table
SliceSharevs benchmarkn
fastly73.2%+38.8pp14,984
akamai58.3%+23.9pp16,020
azure-front-door53.4%+19pp14,942
other-cdn48.6%+14.2pp31,639
cloudfront37.9%+3.5pp5,921
cloudflare35.2%+0.8pp420,719
none30.5%−3.9pp488,814
google17.3%−17.1pp6,961
Edge-driven adoption

HTTP/3 and OCSP stapling are often implemented at the edge

Not affected by the filter above.

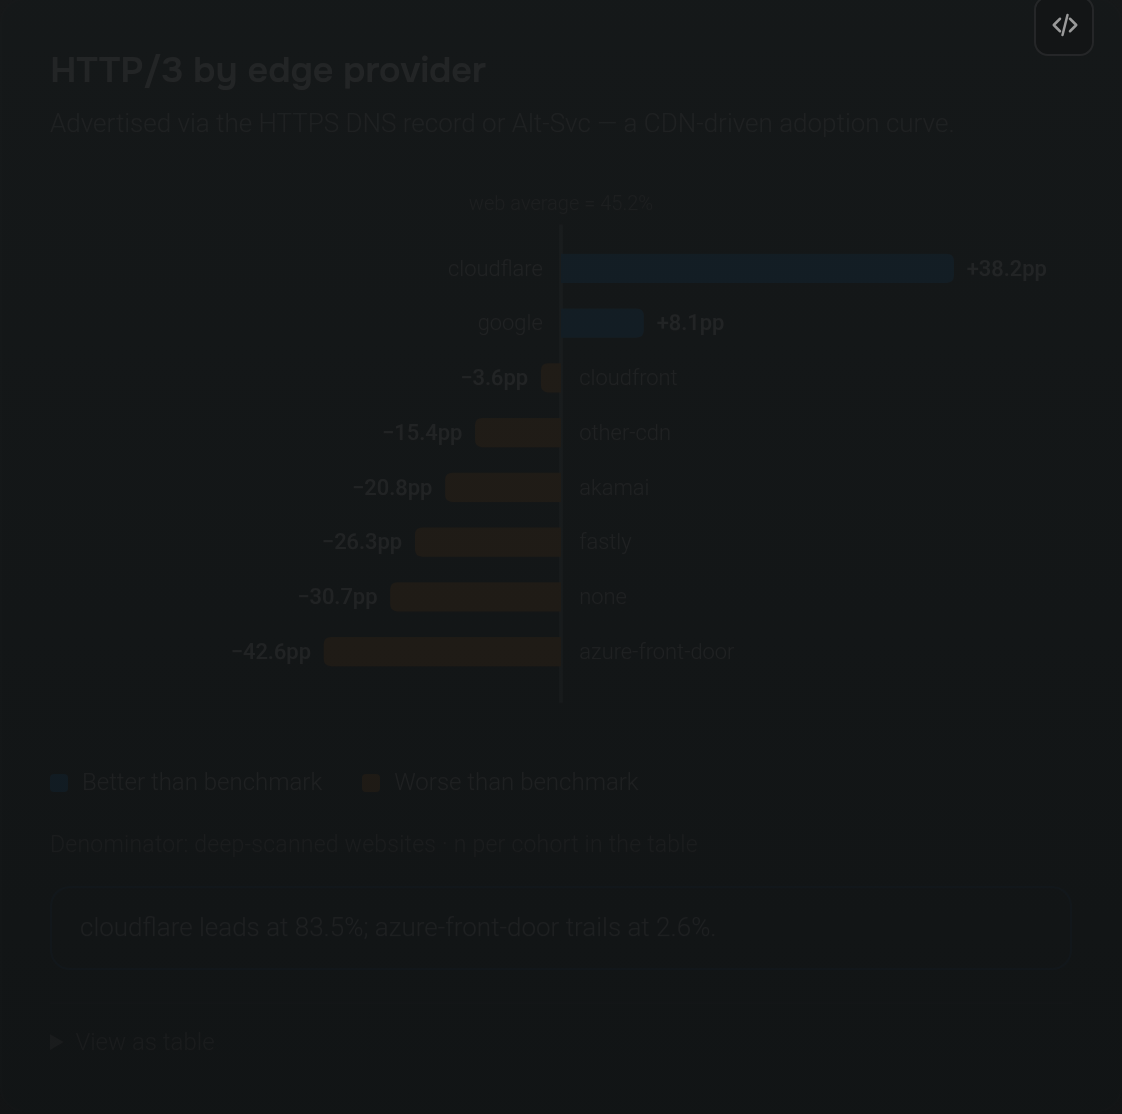
HTTP/3 by edge provider

Advertised via the HTTPS DNS record or Alt-Svc — a CDN-driven adoption curve.

web average = 45.2%cloudflare: 83.5; +38.2pp vs web average = 45.2% (better); n=419553 cloudflare +38.2ppgoogle: 53.3; +8.1pp vs web average = 45.2% (better); n=6802 google +8.1ppcloudfront: 41.6; −3.6pp vs web average = 45.2% (worse); n=5920 cloudfront −3.6ppother-cdn: 29.8; −15.4pp vs web average = 45.2% (worse); n=31530 other-cdn −15.4ppakamai: 24.4; −20.8pp vs web average = 45.2% (worse); n=15946 akamai −20.8ppfastly: 19; −26.3pp vs web average = 45.2% (worse); n=14964 fastly −26.3ppnone: 14.6; −30.7pp vs web average = 45.2% (worse); n=463955 none −30.7ppazure-front-door: 2.6; −42.6pp vs web average = 45.2% (worse); n=14773 azure-front-door −42.6pp
Better than benchmarkWorse than benchmark

Denominator: deep-scanned websites · n per cohort in the table

cloudflare leads at 83.5%; azure-front-door trails at 2.6%.

View as table
SliceSharevs benchmarkn
cloudflare83.5%+38.2pp419,553
google53.3%+8.1pp6,802
cloudfront41.6%−3.6pp5,920
other-cdn29.8%−15.4pp31,530
akamai24.4%−20.8pp15,946
fastly19%−26.3pp14,964
none14.6%−30.7pp463,955
azure-front-door2.6%−42.6pp14,773

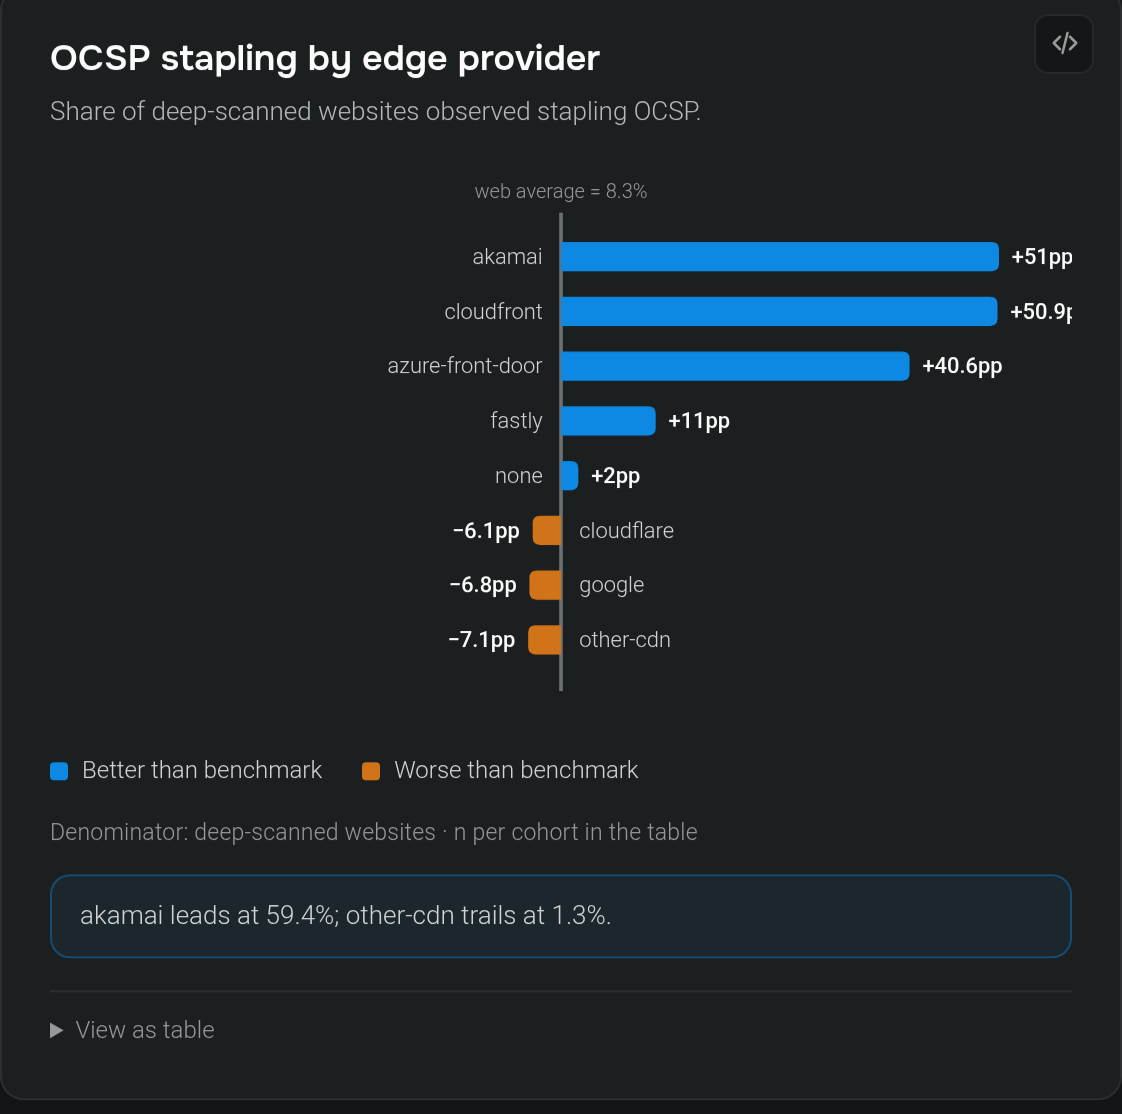
OCSP stapling by edge provider

Share of deep-scanned websites observed stapling OCSP.

web average = 8.3%akamai: 59.4; +51pp vs web average = 8.3% (better); n=15946 akamai +51ppcloudfront: 59.2; +50.9pp vs web average = 8.3% (better); n=5920 cloudfront +50.9ppazure-front-door: 49; +40.6pp vs web average = 8.3% (better); n=14773 azure-front-door +40.6ppfastly: 19.4; +11pp vs web average = 8.3% (better); n=14964 fastly +11ppnone: 10.4; +2pp vs web average = 8.3% (better); n=463955 none +2ppcloudflare: 2.3; −6.1pp vs web average = 8.3% (worse); n=419553 cloudflare −6.1ppgoogle: 1.6; −6.8pp vs web average = 8.3% (worse); n=6802 google −6.8ppother-cdn: 1.3; −7.1pp vs web average = 8.3% (worse); n=31530 other-cdn −7.1pp
Better than benchmarkWorse than benchmark

Denominator: deep-scanned websites · n per cohort in the table

akamai leads at 59.4%; other-cdn trails at 1.3%.

View as table
SliceSharevs benchmarkn
akamai59.4%+51pp15,946
cloudfront59.2%+50.9pp5,920
azure-front-door49%+40.6pp14,773
fastly19.4%+11pp14,964
none10.4%+2pp463,955
cloudflare2.3%−6.1pp419,553
google1.6%−6.8pp6,802
other-cdn1.3%−7.1pp31,530
Loading...