Celebrating 27 Years

Celebrating 27 Years – Announcing the new GeoTrust Horizon® platform. Learn More

GEOTRUST RESEARCH · OCTOBER 2026 CRAWL

The State of SSL/TLS

We used GeoTrust SSL Monitor to analyze the security of the world's 1,000,000 most-visited websites.

INDUSTRY
  • All industries1,000,000
  • Adult25,205
  • Cloud & Infrastructure53,759
  • E-commerce & Retail153,639
  • Education104,381
  • Finance34,943
  • Gaming & Gambling91,102
  • Government22,430
  • Healthcare43,301
  • Media & Social122,588
  • News & Publishing34,946
  • Software & Internet234,505
  • Telecom7,357
  • Travel & Local59,026
  • Other12,818
REGION
  • All regions1,000,000
  • North America151,666
  • South America36,166
  • Europe261,572
  • Asia180,128
  • Middle East23,626
  • Africa11,295
  • Oceania14,128
  • Unknown321,408
RANK
  • All ranks1,000,000
  • top 1k781
  • 1k–10k7,514
  • 10k–100k77,557
  • 100k+914,148

Showing 1,000,000 of 1,000,000 websites

By industry

Which industries lead?

Which industries have the most secure SSL/TLS on their websites?

Not affected by the filter above.

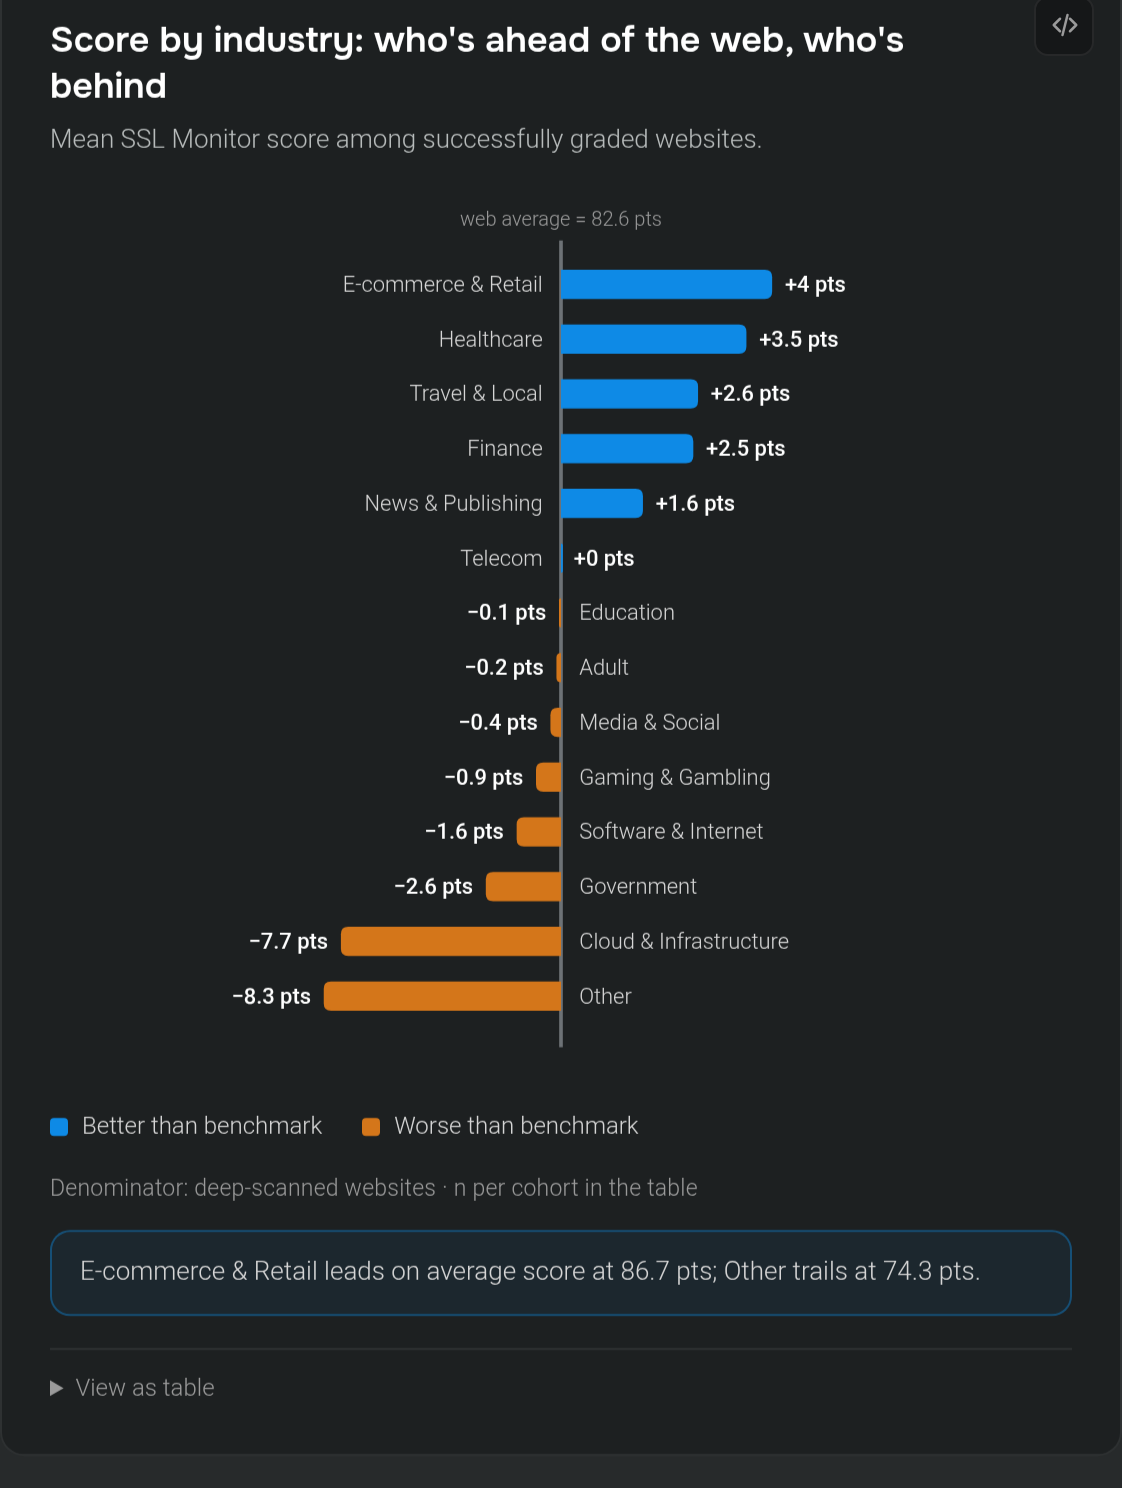
Score by industry: who's ahead of the web, who's behind

Mean SSL Monitor score among successfully graded websites.

web average = 82.6 ptsE-commerce & Retail: 86.7; +4 pts vs web average = 82.6 pts (better); n=151466 E-commerce & Retail +4 ptsHealthcare: 86.2; +3.5 pts vs web average = 82.6 pts (better); n=42642 Healthcare +3.5 ptsTravel & Local: 85.2; +2.6 pts vs web average = 82.6 pts (better); n=58256 Travel & Local +2.6 ptsFinance: 85.2; +2.5 pts vs web average = 82.6 pts (better); n=34232 Finance +2.5 ptsNews & Publishing: 84.2; +1.6 pts vs web average = 82.6 pts (better); n=34542 News & Publishing +1.6 ptsTelecom: 82.6; +0 pts vs web average = 82.6 pts; n=7186 Telecom +0 ptsEducation: 82.6; −0.1 pts vs web average = 82.6 pts (worse); n=102118 Education −0.1 ptsAdult: 82.5; −0.2 pts vs web average = 82.6 pts (worse); n=24873 Adult −0.2 ptsMedia & Social: 82.3; −0.4 pts vs web average = 82.6 pts (worse); n=120053 Media & Social −0.4 ptsGaming & Gambling: 81.8; −0.9 pts vs web average = 82.6 pts (worse); n=89932 Gaming & Gambling −0.9 ptsSoftware & Internet: 81.1; −1.6 pts vs web average = 82.6 pts (worse); n=221156 Software & Internet −1.6 ptsGovernment: 80; −2.6 pts vs web average = 82.6 pts (worse); n=21988 Government −2.6 ptsCloud & Infrastructure: 74.9; −7.7 pts vs web average = 82.6 pts (worse); n=53540 Cloud & Infrastructure −7.7 ptsOther: 74.3; −8.3 pts vs web average = 82.6 pts (worse); n=11457 Other −8.3 pts
Better than benchmarkWorse than benchmark

Denominator: deep-scanned websites · n per cohort in the table

E-commerce & Retail leads on average score at 86.7 pts; Other trails at 74.3 pts.

View as table
SliceAverage scorevs benchmarkn
E-commerce & Retail86.7 pts+4 pts151,466
Healthcare86.2 pts+3.5 pts42,642
Travel & Local85.2 pts+2.6 pts58,256
Finance85.2 pts+2.5 pts34,232
News & Publishing84.2 pts+1.6 pts34,542
Telecom82.6 pts±0 pts7,186
Education82.6 pts−0.1 pts102,118
Adult82.5 pts−0.2 pts24,873
Media & Social82.3 pts−0.4 pts120,053
Gaming & Gambling81.8 pts−0.9 pts89,932
Software & Internet81.1 pts−1.6 pts221,156
Government80 pts−2.6 pts21,988
Cloud & Infrastructure74.9 pts−7.7 pts53,540
Other74.3 pts−8.3 pts11,457

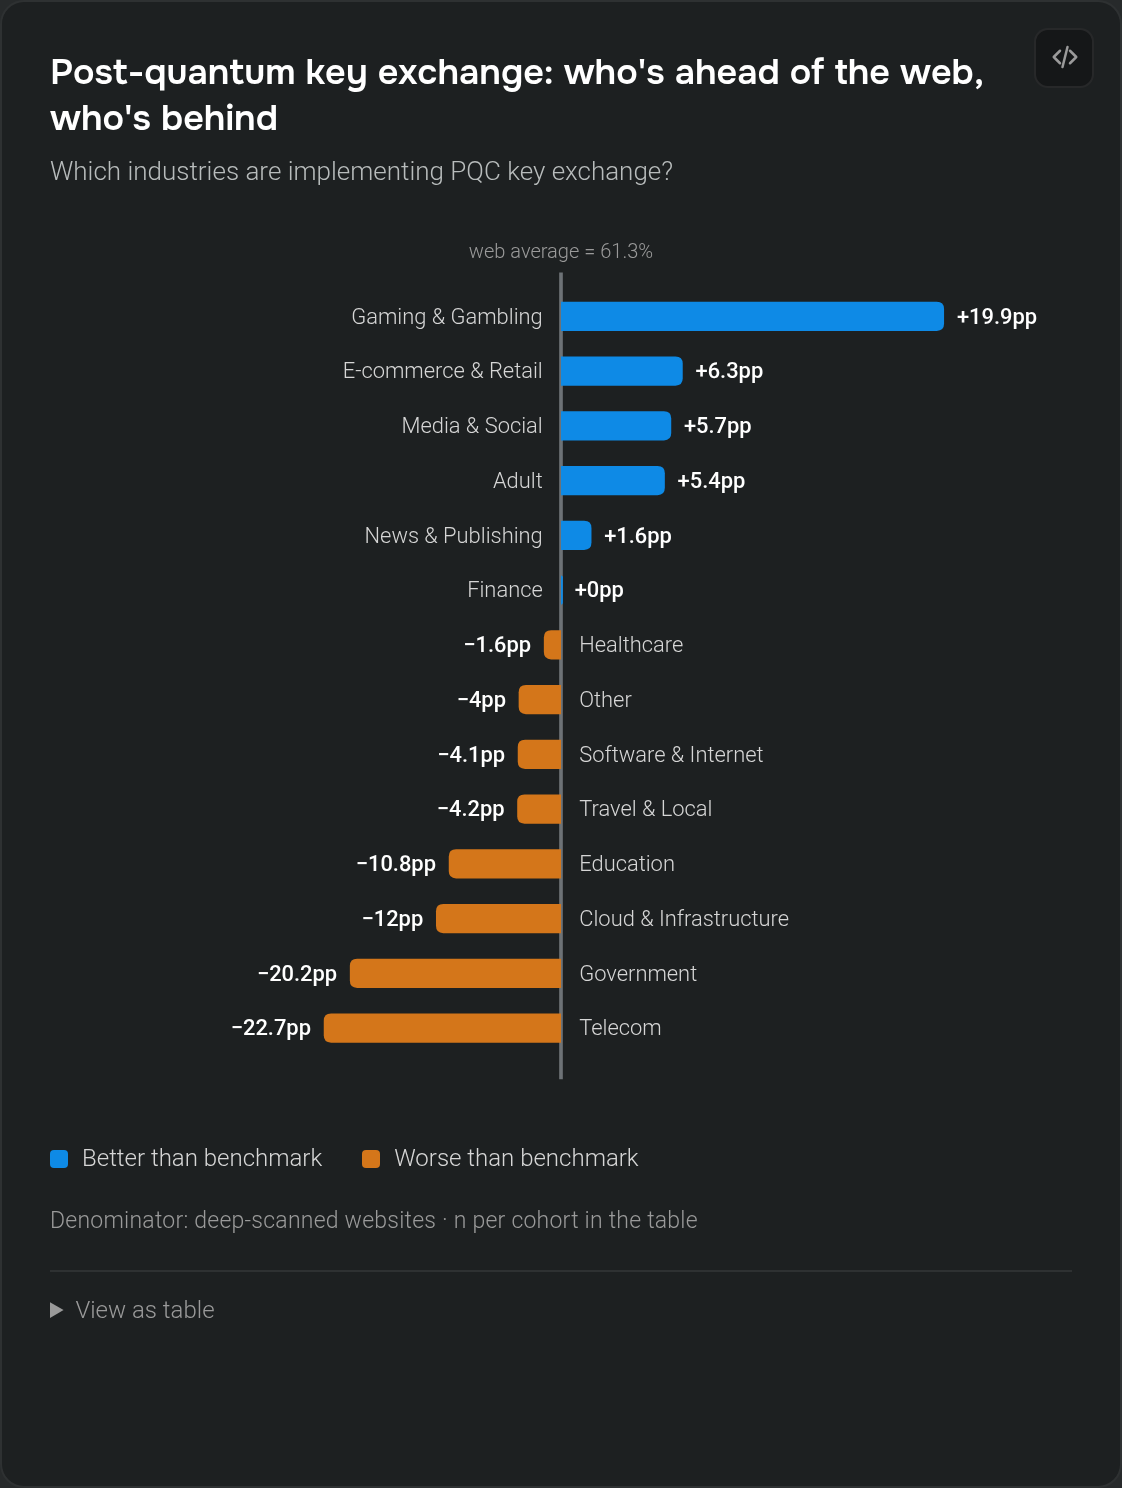
Post-quantum key exchange: who's ahead of the web, who's behind

Which industries are implementing PQC key exchange?

web average = 61.3%Gaming & Gambling: 81.2; +19.9pp vs web average = 61.3% (better); n=89932 Gaming & Gambling +19.9ppE-commerce & Retail: 67.6; +6.3pp vs web average = 61.3% (better); n=151466 E-commerce & Retail +6.3ppMedia & Social: 67; +5.7pp vs web average = 61.3% (better); n=120053 Media & Social +5.7ppAdult: 66.7; +5.4pp vs web average = 61.3% (better); n=24873 Adult +5.4ppNews & Publishing: 62.9; +1.6pp vs web average = 61.3% (better); n=34542 News & Publishing +1.6ppFinance: 61.4; +0pp vs web average = 61.3% (better); n=34232 Finance +0ppHealthcare: 59.7; −1.6pp vs web average = 61.3% (worse); n=42642 Healthcare −1.6ppOther: 57.3; −4pp vs web average = 61.3% (worse); n=11457 Other −4ppSoftware & Internet: 57.2; −4.1pp vs web average = 61.3% (worse); n=221156 Software & Internet −4.1ppTravel & Local: 57.1; −4.2pp vs web average = 61.3% (worse); n=58256 Travel & Local −4.2ppEducation: 50.6; −10.8pp vs web average = 61.3% (worse); n=102118 Education −10.8ppCloud & Infrastructure: 49.3; −12pp vs web average = 61.3% (worse); n=53540 Cloud & Infrastructure −12ppGovernment: 41.1; −20.2pp vs web average = 61.3% (worse); n=21988 Government −20.2ppTelecom: 38.6; −22.7pp vs web average = 61.3% (worse); n=7186 Telecom −22.7pp
Better than benchmarkWorse than benchmark

Denominator: deep-scanned websites · n per cohort in the table

View as table
SliceSharevs benchmarkn
Gaming & Gambling81.2%+19.9pp89,932
E-commerce & Retail67.6%+6.3pp151,466
Media & Social67%+5.7pp120,053
Adult66.7%+5.4pp24,873
News & Publishing62.9%+1.6pp34,542
Finance61.4%+0pp34,232
Healthcare59.7%−1.6pp42,642
Other57.3%−4pp11,457
Software & Internet57.2%−4.1pp221,156
Travel & Local57.1%−4.2pp58,256
Education50.6%−10.8pp102,118
Cloud & Infrastructure49.3%−12pp53,540
Government41.1%−20.2pp21,988
Telecom38.6%−22.7pp7,186

TLS 1.3 by industry: who's ahead of the web, who's behind

Share of deep-scanned websites accepting or negotiating TLS 1.3.

web average = 89.5%Gaming & Gambling: 93.4; +4pp vs web average = 89.5% (better); n=89932 Gaming & Gambling +4ppE-commerce & Retail: 92.1; +2.7pp vs web average = 89.5% (better); n=151466 E-commerce & Retail +2.7ppMedia & Social: 91.3; +1.9pp vs web average = 89.5% (better); n=120053 Media & Social +1.9ppNews & Publishing: 90.6; +1.2pp vs web average = 89.5% (better); n=34542 News & Publishing +1.2ppTravel & Local: 90; +0.5pp vs web average = 89.5% (better); n=58256 Travel & Local +0.5ppHealthcare: 89.5; +0.1pp vs web average = 89.5% (better); n=42642 Healthcare +0.1ppFinance: 89.1; −0.3pp vs web average = 89.5% (worse); n=34232 Finance −0.3ppSoftware & Internet: 88; −1.4pp vs web average = 89.5% (worse); n=221156 Software & Internet −1.4ppOther: 87.8; −1.7pp vs web average = 89.5% (worse); n=11457 Other −1.7ppEducation: 87.3; −2.2pp vs web average = 89.5% (worse); n=102118 Education −2.2ppCloud & Infrastructure: 86.4; −3.1pp vs web average = 89.5% (worse); n=53540 Cloud & Infrastructure −3.1ppAdult: 84.9; −4.6pp vs web average = 89.5% (worse); n=24873 Adult −4.6ppTelecom: 82.7; −6.8pp vs web average = 89.5% (worse); n=7186 Telecom −6.8ppGovernment: 81.8; −7.7pp vs web average = 89.5% (worse); n=21988 Government −7.7pp
Better than benchmarkWorse than benchmark

Denominator: deep-scanned websites · n per cohort in the table

Gaming & Gambling leads on TLS 1.3 at 93.4%; Government trails at 81.8%.

View as table
SliceSharevs benchmarkn
Gaming & Gambling93.4%+4pp89,932
E-commerce & Retail92.1%+2.7pp151,466
Media & Social91.3%+1.9pp120,053
News & Publishing90.6%+1.2pp34,542
Travel & Local90%+0.5pp58,256
Healthcare89.5%+0.1pp42,642
Finance89.1%−0.3pp34,232
Software & Internet88%−1.4pp221,156
Other87.8%−1.7pp11,457
Education87.3%−2.2pp102,118
Cloud & Infrastructure86.4%−3.1pp53,540
Adult84.9%−4.6pp24,873
Telecom82.7%−6.8pp7,186
Government81.8%−7.7pp21,988

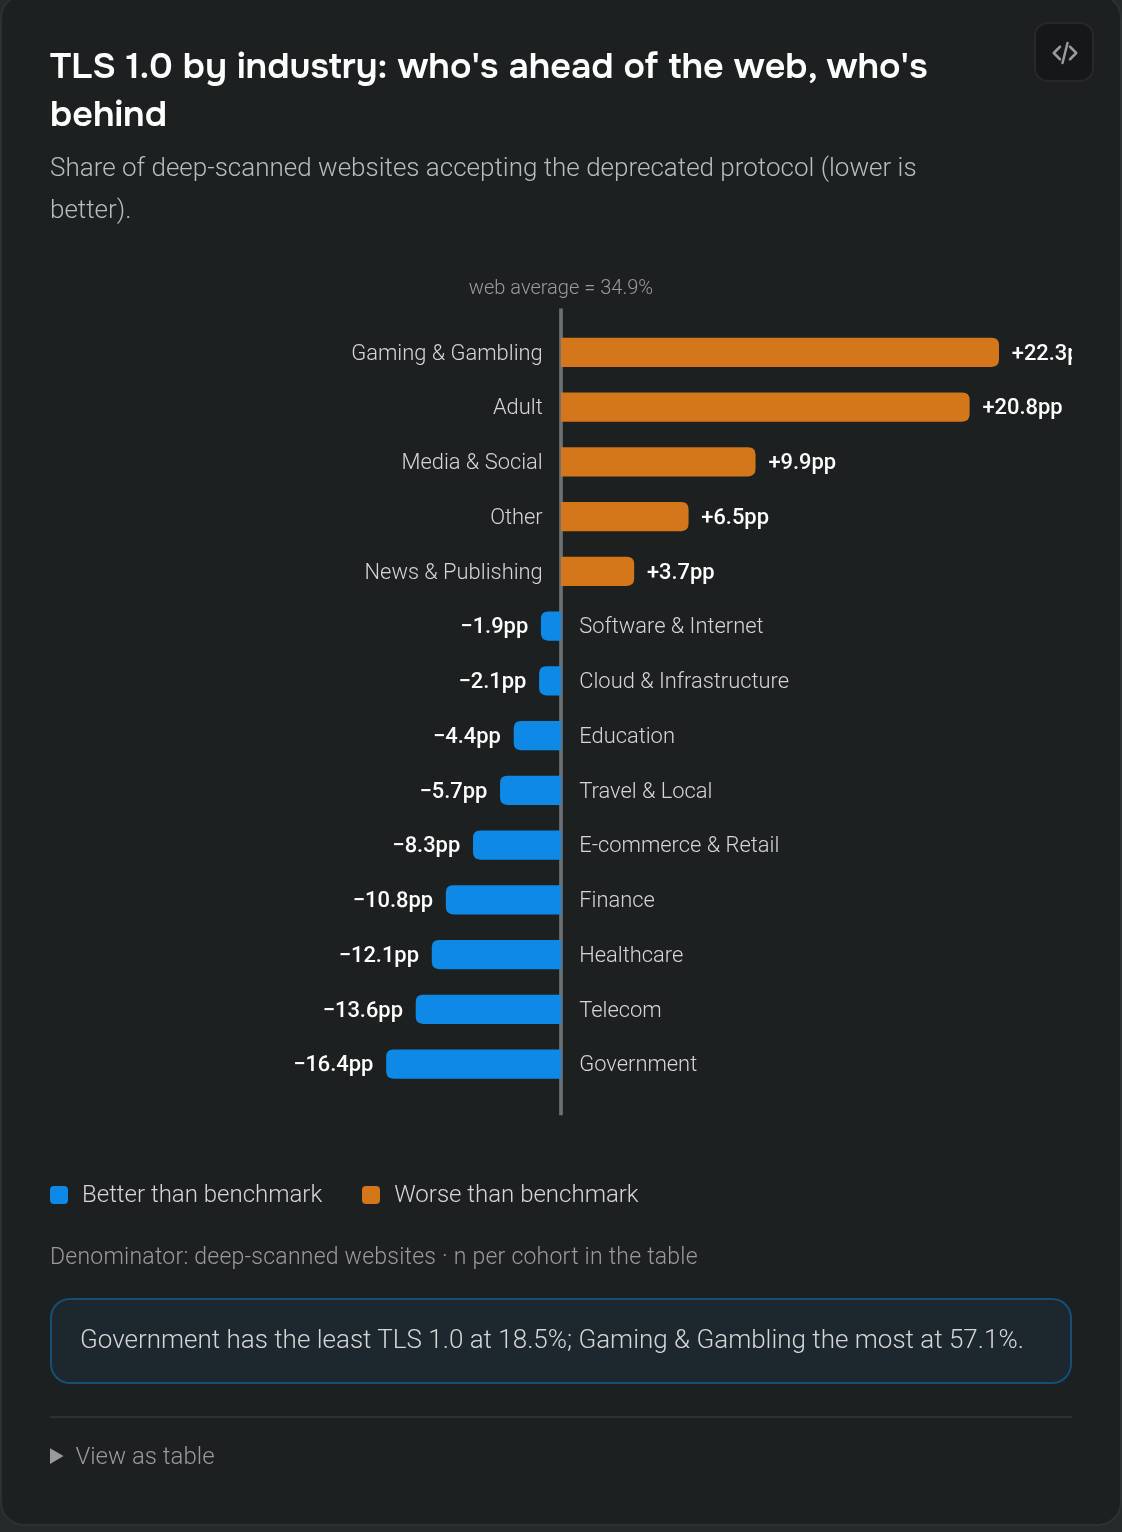
TLS 1.0 by industry: who's ahead of the web, who's behind

Share of deep-scanned websites accepting the deprecated protocol (lower is better).

web average = 34.9%Gaming & Gambling: 57.1; +22.3pp vs web average = 34.9% (worse); n=89932 Gaming & Gambling +22.3ppAdult: 55.7; +20.8pp vs web average = 34.9% (worse); n=24873 Adult +20.8ppMedia & Social: 44.8; +9.9pp vs web average = 34.9% (worse); n=120053 Media & Social +9.9ppOther: 41.4; +6.5pp vs web average = 34.9% (worse); n=11457 Other +6.5ppNews & Publishing: 38.6; +3.7pp vs web average = 34.9% (worse); n=34542 News & Publishing +3.7ppSoftware & Internet: 33; −1.9pp vs web average = 34.9% (better); n=221156 Software & Internet −1.9ppCloud & Infrastructure: 32.8; −2.1pp vs web average = 34.9% (better); n=53540 Cloud & Infrastructure −2.1ppEducation: 30.4; −4.4pp vs web average = 34.9% (better); n=102118 Education −4.4ppTravel & Local: 29.2; −5.7pp vs web average = 34.9% (better); n=58256 Travel & Local −5.7ppE-commerce & Retail: 26.6; −8.3pp vs web average = 34.9% (better); n=151466 E-commerce & Retail −8.3ppFinance: 24.1; −10.8pp vs web average = 34.9% (better); n=34232 Finance −10.8ppHealthcare: 22.8; −12.1pp vs web average = 34.9% (better); n=42642 Healthcare −12.1ppTelecom: 21.3; −13.6pp vs web average = 34.9% (better); n=7186 Telecom −13.6ppGovernment: 18.5; −16.4pp vs web average = 34.9% (better); n=21988 Government −16.4pp
Better than benchmarkWorse than benchmark

Denominator: deep-scanned websites · n per cohort in the table

Government has the least TLS 1.0 at 18.5%; Gaming & Gambling the most at 57.1%.

View as table
SliceSharevs benchmarkn
Gaming & Gambling57.1%+22.3pp89,932
Adult55.7%+20.8pp24,873
Media & Social44.8%+9.9pp120,053
Other41.4%+6.5pp11,457
News & Publishing38.6%+3.7pp34,542
Software & Internet33%−1.9pp221,156
Cloud & Infrastructure32.8%−2.1pp53,540
Education30.4%−4.4pp102,118
Travel & Local29.2%−5.7pp58,256
E-commerce & Retail26.6%−8.3pp151,466
Finance24.1%−10.8pp34,232
Healthcare22.8%−12.1pp42,642
Telecom21.3%−13.6pp7,186
Government18.5%−16.4pp21,988
By country

Which countries lead?

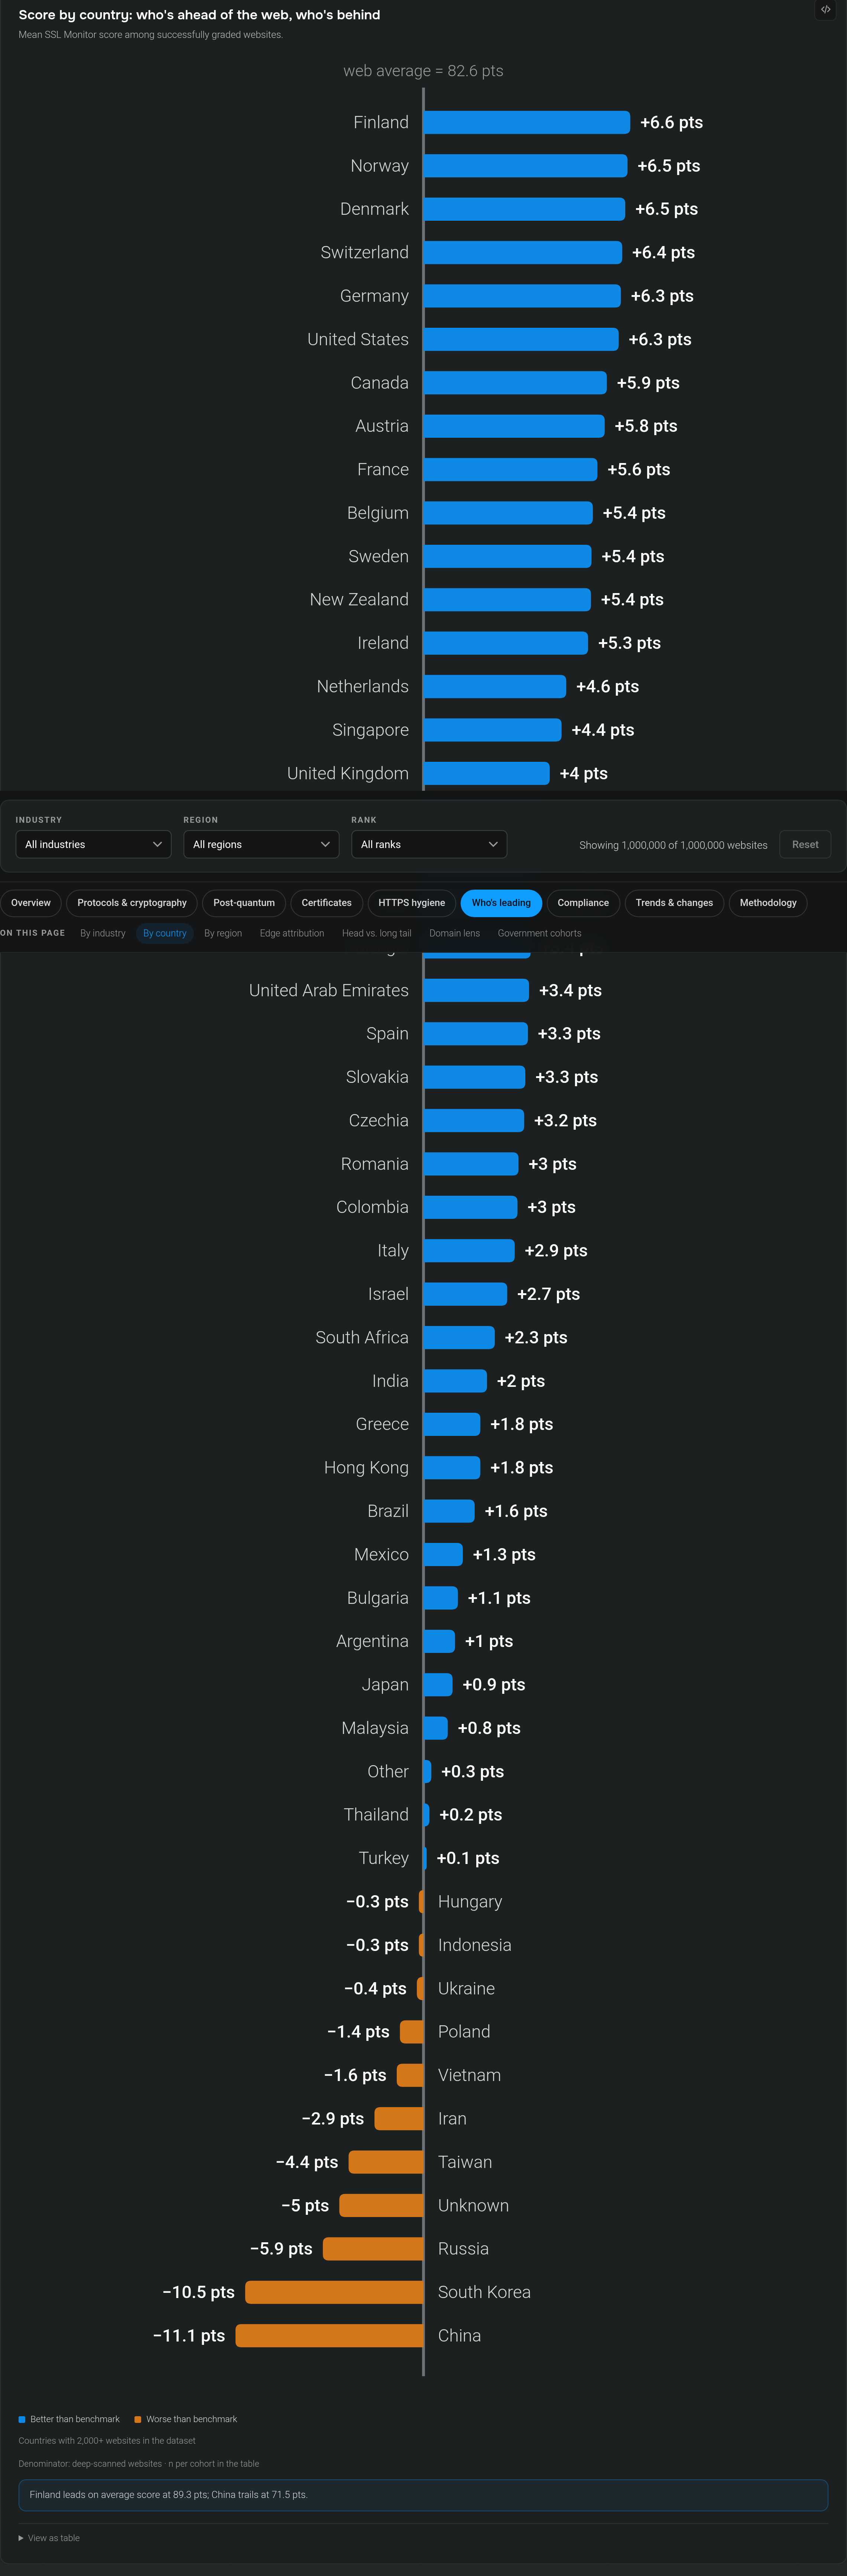
Score by country: who's ahead of the web, who's behind

Mean SSL Monitor score among successfully graded websites.

web average = 82.6 ptsFinland: 89.3; +6.6 pts vs web average = 82.6 pts (better); n=3337 Finland +6.6 ptsNorway: 89.2; +6.5 pts vs web average = 82.6 pts (better); n=2604 Norway +6.5 ptsDenmark: 89.1; +6.5 pts vs web average = 82.6 pts (better); n=3546 Denmark +6.5 ptsSwitzerland: 89; +6.4 pts vs web average = 82.6 pts (better); n=6043 Switzerland +6.4 ptsGermany: 89; +6.3 pts vs web average = 82.6 pts (better); n=39996 Germany +6.3 ptsUnited States: 88.9; +6.3 pts vs web average = 82.6 pts (better); n=129602 United States +6.3 ptsCanada: 88.5; +5.9 pts vs web average = 82.6 pts (better); n=13809 Canada +5.9 ptsAustria: 88.4; +5.8 pts vs web average = 82.6 pts (better); n=4787 Austria +5.8 ptsFrance: 88.2; +5.6 pts vs web average = 82.6 pts (better); n=21030 France +5.6 ptsBelgium: 88; +5.4 pts vs web average = 82.6 pts (better); n=5051 Belgium +5.4 ptsSweden: 88; +5.4 pts vs web average = 82.6 pts (better); n=5306 Sweden +5.4 ptsNew Zealand: 88; +5.4 pts vs web average = 82.6 pts (better); n=2145 New Zealand +5.4 ptsIreland: 87.9; +5.3 pts vs web average = 82.6 pts (better); n=2216 Ireland +5.3 ptsNetherlands: 87.2; +4.6 pts vs web average = 82.6 pts (better); n=24615 Netherlands +4.6 ptsSingapore: 87; +4.4 pts vs web average = 82.6 pts (better); n=2405 Singapore +4.4 ptsUnited Kingdom: 86.7; +4 pts vs web average = 82.6 pts (better); n=46178 United Kingdom +4 ptsAustralia: 86.6; +4 pts vs web average = 82.6 pts (better); n=11533 Australia +4 ptsPakistan: 86.2; +3.6 pts vs web average = 82.6 pts (better); n=2944 Pakistan +3.6 ptsChile: 86.1; +3.5 pts vs web average = 82.6 pts (better); n=2965 Chile +3.5 ptsPortugal: 86.1; +3.4 pts vs web average = 82.6 pts (better); n=3008 Portugal +3.4 ptsUnited Arab Emirates: 86; +3.4 pts vs web average = 82.6 pts (better); n=2256 United Arab Emirates +3.4 ptsSpain: 86; +3.3 pts vs web average = 82.6 pts (better); n=13574 Spain +3.3 ptsSlovakia: 85.9; +3.3 pts vs web average = 82.6 pts (better); n=2432 Slovakia +3.3 ptsCzechia: 85.8; +3.2 pts vs web average = 82.6 pts (better); n=6946 Czechia +3.2 ptsRomania: 85.7; +3 pts vs web average = 82.6 pts (better); n=5139 Romania +3 ptsColombia: 85.6; +3 pts vs web average = 82.6 pts (better); n=2770 Colombia +3 ptsItaly: 85.5; +2.9 pts vs web average = 82.6 pts (better); n=16906 Italy +2.9 ptsIsrael: 85.3; +2.7 pts vs web average = 82.6 pts (better); n=2396 Israel +2.7 ptsSouth Africa: 84.9; +2.3 pts vs web average = 82.6 pts (better); n=3377 South Africa +2.3 ptsIndia: 84.7; +2 pts vs web average = 82.6 pts (better); n=23180 India +2 ptsGreece: 84.5; +1.8 pts vs web average = 82.6 pts (better); n=4431 Greece +1.8 ptsHong Kong: 84.5; +1.8 pts vs web average = 82.6 pts (better); n=2730 Hong Kong +1.8 ptsBrazil: 84.3; +1.6 pts vs web average = 82.6 pts (better); n=21812 Brazil +1.6 ptsMexico: 83.9; +1.3 pts vs web average = 82.6 pts (better); n=4519 Mexico +1.3 ptsBulgaria: 83.7; +1.1 pts vs web average = 82.6 pts (better); n=2131 Bulgaria +1.1 ptsArgentina: 83.6; +1 pts vs web average = 82.6 pts (better); n=4190 Argentina +1 ptsJapan: 83.6; +0.9 pts vs web average = 82.6 pts (better); n=27058 Japan +0.9 ptsMalaysia: 83.4; +0.8 pts vs web average = 82.6 pts (better); n=2484 Malaysia +0.8 ptsOther: 82.9; +0.3 pts vs web average = 82.6 pts (better); n=3536 Other +0.3 ptsThailand: 82.8; +0.2 pts vs web average = 82.6 pts (better); n=5113 Thailand +0.2 ptsTurkey: 82.7; +0.1 pts vs web average = 82.6 pts (better); n=8762 Turkey +0.1 ptsHungary: 82.4; −0.3 pts vs web average = 82.6 pts (worse); n=3817 Hungary −0.3 ptsIndonesia: 82.4; −0.3 pts vs web average = 82.6 pts (worse); n=18958 Indonesia −0.3 ptsUkraine: 82.2; −0.4 pts vs web average = 82.6 pts (worse); n=6709 Ukraine −0.4 ptsPoland: 81.2; −1.4 pts vs web average = 82.6 pts (worse); n=12320 Poland −1.4 ptsVietnam: 81; −1.6 pts vs web average = 82.6 pts (worse); n=4549 Vietnam −1.6 ptsIran: 79.7; −2.9 pts vs web average = 82.6 pts (worse); n=5804 Iran −2.9 ptsTaiwan: 78.2; −4.4 pts vs web average = 82.6 pts (worse); n=3159 Taiwan −4.4 ptsUnknown: 77.7; −5 pts vs web average = 82.6 pts (worse); n=306666 Unknown −5 ptsRussia: 76.7; −5.9 pts vs web average = 82.6 pts (worse); n=39009 Russia −5.9 ptsSouth Korea: 72.1; −10.5 pts vs web average = 82.6 pts (worse); n=7887 South Korea −10.5 ptsChina: 71.5; −11.1 pts vs web average = 82.6 pts (worse); n=26213 China −11.1 pts
Better than benchmarkWorse than benchmark

Countries with 2,000+ websites in the dataset

Denominator: deep-scanned websites · n per cohort in the table

Finland leads on average score at 89.3 pts; China trails at 71.5 pts.

View as table
SliceAverage scorevs benchmarkn
Finland89.3 pts+6.6 pts3,337
Norway89.2 pts+6.5 pts2,604
Denmark89.1 pts+6.5 pts3,546
Switzerland89 pts+6.4 pts6,043
Germany89 pts+6.3 pts39,996
United States88.9 pts+6.3 pts129,602
Canada88.5 pts+5.9 pts13,809
Austria88.4 pts+5.8 pts4,787
France88.2 pts+5.6 pts21,030
Belgium88 pts+5.4 pts5,051
Sweden88 pts+5.4 pts5,306
New Zealand88 pts+5.4 pts2,145
Ireland87.9 pts+5.3 pts2,216
Netherlands87.2 pts+4.6 pts24,615
Singapore87 pts+4.4 pts2,405
United Kingdom86.7 pts+4 pts46,178
Australia86.6 pts+4 pts11,533
Pakistan86.2 pts+3.6 pts2,944
Chile86.1 pts+3.5 pts2,965
Portugal86.1 pts+3.4 pts3,008
United Arab Emirates86 pts+3.4 pts2,256
Spain86 pts+3.3 pts13,574
Slovakia85.9 pts+3.3 pts2,432
Czechia85.8 pts+3.2 pts6,946
Romania85.7 pts+3 pts5,139
Colombia85.6 pts+3 pts2,770
Italy85.5 pts+2.9 pts16,906
Israel85.3 pts+2.7 pts2,396
South Africa84.9 pts+2.3 pts3,377
India84.7 pts+2 pts23,180
Greece84.5 pts+1.8 pts4,431
Hong Kong84.5 pts+1.8 pts2,730
Brazil84.3 pts+1.6 pts21,812
Mexico83.9 pts+1.3 pts4,519
Bulgaria83.7 pts+1.1 pts2,131
Argentina83.6 pts+1 pts4,190
Japan83.6 pts+0.9 pts27,058
Malaysia83.4 pts+0.8 pts2,484
Other82.9 pts+0.3 pts3,536
Thailand82.8 pts+0.2 pts5,113
Turkey82.7 pts+0.1 pts8,762
Hungary82.4 pts−0.3 pts3,817
Indonesia82.4 pts−0.3 pts18,958
Ukraine82.2 pts−0.4 pts6,709
Poland81.2 pts−1.4 pts12,320
Vietnam81 pts−1.6 pts4,549
Iran79.7 pts−2.9 pts5,804
Taiwan78.2 pts−4.4 pts3,159
Unknown77.7 pts−5 pts306,666
Russia76.7 pts−5.9 pts39,009
South Korea72.1 pts−10.5 pts7,887
China71.5 pts−11.1 pts26,213

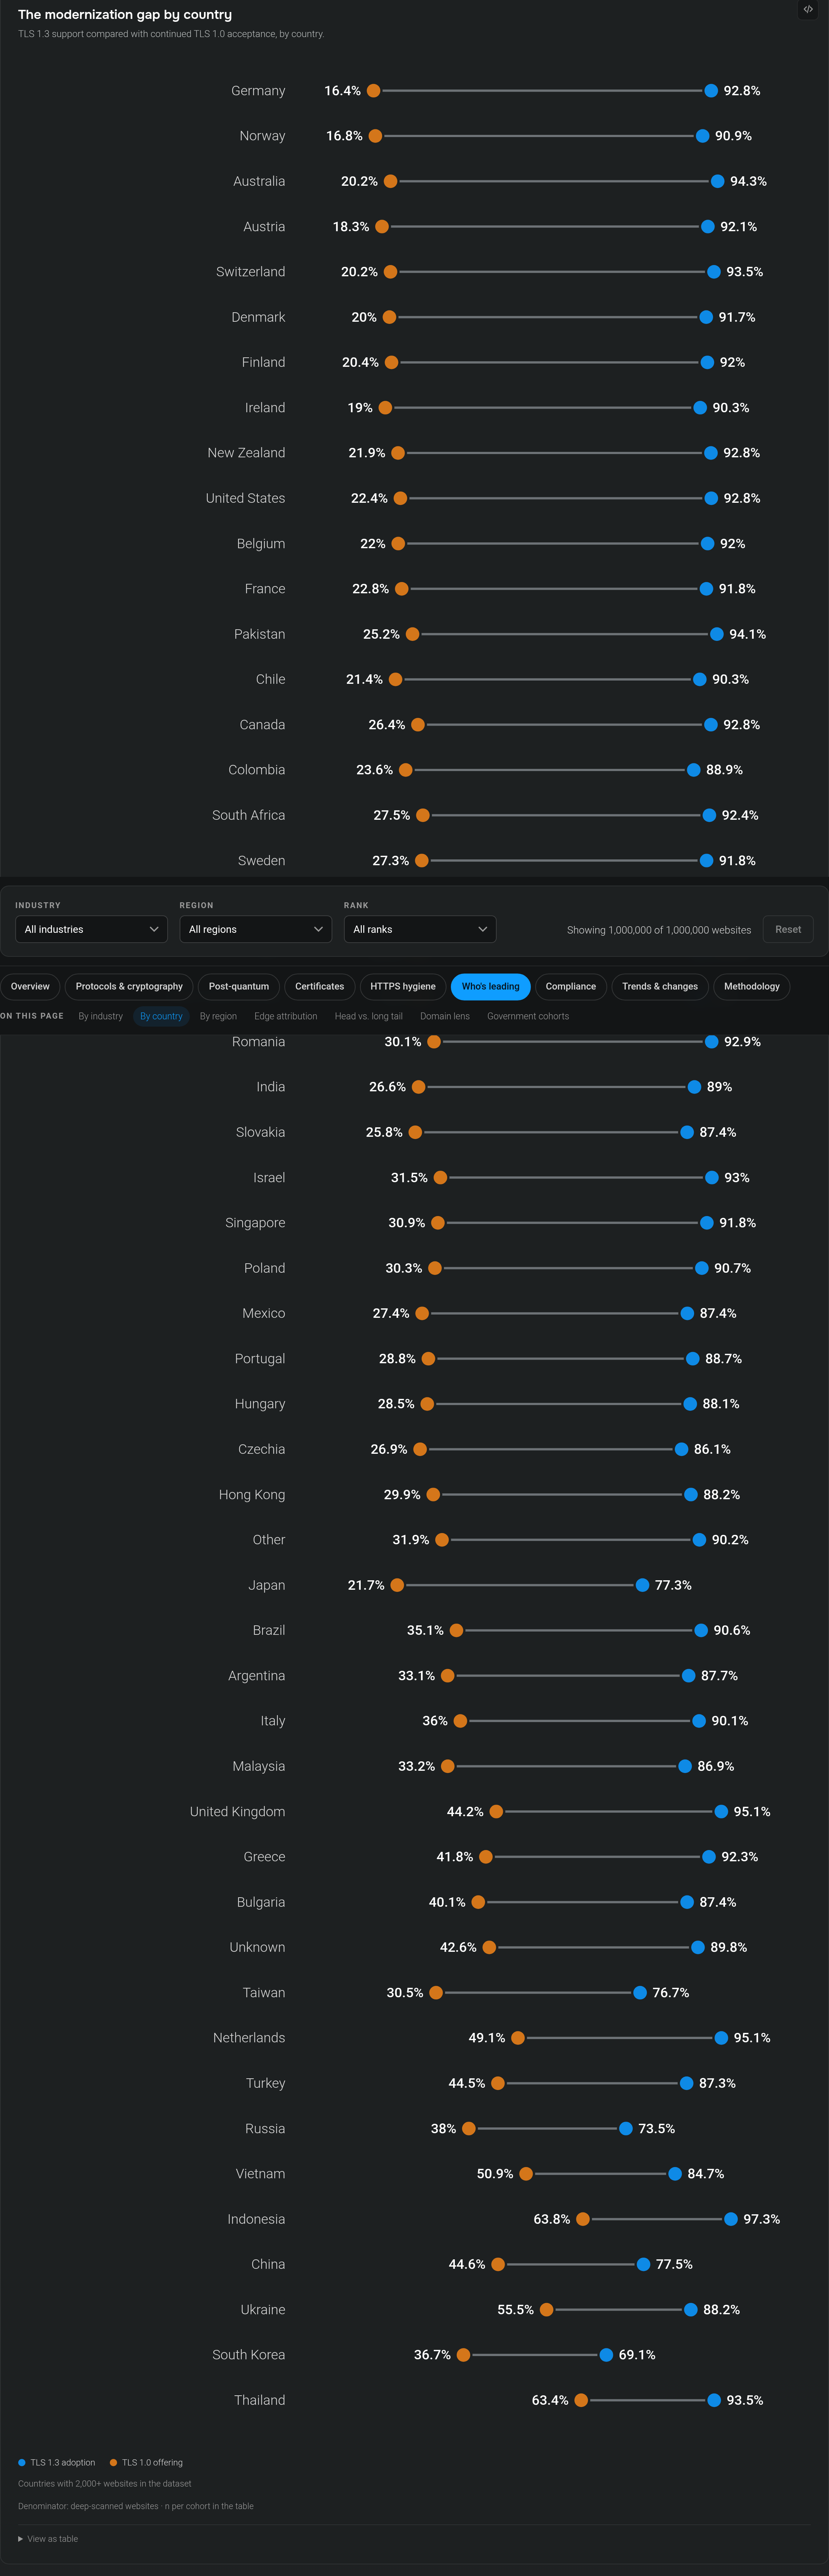
The modernization gap by country

TLS 1.3 support compared with continued TLS 1.0 acceptance, by country.

Germany: TLS 1.3 adoption 92.8%; TLS 1.0 offering 16.4%; n=39,996Germany 16.4%92.8%Norway: TLS 1.3 adoption 90.9%; TLS 1.0 offering 16.8%; n=2,604Norway 16.8%90.9%Australia: TLS 1.3 adoption 94.3%; TLS 1.0 offering 20.2%; n=11,533Australia 20.2%94.3%Austria: TLS 1.3 adoption 92.1%; TLS 1.0 offering 18.3%; n=4,787Austria 18.3%92.1%Switzerland: TLS 1.3 adoption 93.5%; TLS 1.0 offering 20.2%; n=6,043Switzerland 20.2%93.5%Denmark: TLS 1.3 adoption 91.7%; TLS 1.0 offering 20%; n=3,546Denmark 20%91.7%Finland: TLS 1.3 adoption 92%; TLS 1.0 offering 20.4%; n=3,337Finland 20.4%92%Ireland: TLS 1.3 adoption 90.3%; TLS 1.0 offering 19%; n=2,216Ireland 19%90.3%New Zealand: TLS 1.3 adoption 92.8%; TLS 1.0 offering 21.9%; n=2,145New Zealand 21.9%92.8%United States: TLS 1.3 adoption 92.8%; TLS 1.0 offering 22.4%; n=129,602United States 22.4%92.8%Belgium: TLS 1.3 adoption 92%; TLS 1.0 offering 22%; n=5,051Belgium 22%92%France: TLS 1.3 adoption 91.8%; TLS 1.0 offering 22.8%; n=21,030France 22.8%91.8%Pakistan: TLS 1.3 adoption 94.1%; TLS 1.0 offering 25.2%; n=2,944Pakistan 25.2%94.1%Chile: TLS 1.3 adoption 90.3%; TLS 1.0 offering 21.4%; n=2,965Chile 21.4%90.3%Canada: TLS 1.3 adoption 92.8%; TLS 1.0 offering 26.4%; n=13,809Canada 26.4%92.8%Colombia: TLS 1.3 adoption 88.9%; TLS 1.0 offering 23.6%; n=2,770Colombia 23.6%88.9%South Africa: TLS 1.3 adoption 92.4%; TLS 1.0 offering 27.5%; n=3,377South Africa 27.5%92.4%Sweden: TLS 1.3 adoption 91.8%; TLS 1.0 offering 27.3%; n=5,306Sweden 27.3%91.8%Iran: TLS 1.3 adoption 90.8%; TLS 1.0 offering 26.4%; n=5,804Iran 26.4%90.8%Spain: TLS 1.3 adoption 90.6%; TLS 1.0 offering 26.5%; n=13,574Spain 26.5%90.6%United Arab Emirates: TLS 1.3 adoption 90%; TLS 1.0 offering 27%; n=2,256United Arab Emirates 27%90%Romania: TLS 1.3 adoption 92.9%; TLS 1.0 offering 30.1%; n=5,139Romania 30.1%92.9%India: TLS 1.3 adoption 89%; TLS 1.0 offering 26.6%; n=23,180India 26.6%89%Slovakia: TLS 1.3 adoption 87.4%; TLS 1.0 offering 25.8%; n=2,432Slovakia 25.8%87.4%Israel: TLS 1.3 adoption 93%; TLS 1.0 offering 31.5%; n=2,396Israel 31.5%93%Singapore: TLS 1.3 adoption 91.8%; TLS 1.0 offering 30.9%; n=2,405Singapore 30.9%91.8%Poland: TLS 1.3 adoption 90.7%; TLS 1.0 offering 30.3%; n=12,320Poland 30.3%90.7%Mexico: TLS 1.3 adoption 87.4%; TLS 1.0 offering 27.4%; n=4,519Mexico 27.4%87.4%Portugal: TLS 1.3 adoption 88.7%; TLS 1.0 offering 28.8%; n=3,008Portugal 28.8%88.7%Hungary: TLS 1.3 adoption 88.1%; TLS 1.0 offering 28.5%; n=3,817Hungary 28.5%88.1%Czechia: TLS 1.3 adoption 86.1%; TLS 1.0 offering 26.9%; n=6,946Czechia 26.9%86.1%Hong Kong: TLS 1.3 adoption 88.2%; TLS 1.0 offering 29.9%; n=2,730Hong Kong 29.9%88.2%Other: TLS 1.3 adoption 90.2%; TLS 1.0 offering 31.9%; n=3,536Other 31.9%90.2%Japan: TLS 1.3 adoption 77.3%; TLS 1.0 offering 21.7%; n=27,058Japan 21.7%77.3%Brazil: TLS 1.3 adoption 90.6%; TLS 1.0 offering 35.1%; n=21,812Brazil 35.1%90.6%Argentina: TLS 1.3 adoption 87.7%; TLS 1.0 offering 33.1%; n=4,190Argentina 33.1%87.7%Italy: TLS 1.3 adoption 90.1%; TLS 1.0 offering 36%; n=16,906Italy 36%90.1%Malaysia: TLS 1.3 adoption 86.9%; TLS 1.0 offering 33.2%; n=2,484Malaysia 33.2%86.9%United Kingdom: TLS 1.3 adoption 95.1%; TLS 1.0 offering 44.2%; n=46,178United Kingdom 44.2%95.1%Greece: TLS 1.3 adoption 92.3%; TLS 1.0 offering 41.8%; n=4,431Greece 41.8%92.3%Bulgaria: TLS 1.3 adoption 87.4%; TLS 1.0 offering 40.1%; n=2,131Bulgaria 40.1%87.4%Unknown: TLS 1.3 adoption 89.8%; TLS 1.0 offering 42.6%; n=306,666Unknown 42.6%89.8%Taiwan: TLS 1.3 adoption 76.7%; TLS 1.0 offering 30.5%; n=3,159Taiwan 30.5%76.7%Netherlands: TLS 1.3 adoption 95.1%; TLS 1.0 offering 49.1%; n=24,615Netherlands 49.1%95.1%Turkey: TLS 1.3 adoption 87.3%; TLS 1.0 offering 44.5%; n=8,762Turkey 44.5%87.3%Russia: TLS 1.3 adoption 73.5%; TLS 1.0 offering 38%; n=39,009Russia 38%73.5%Vietnam: TLS 1.3 adoption 84.7%; TLS 1.0 offering 50.9%; n=4,549Vietnam 50.9%84.7%Indonesia: TLS 1.3 adoption 97.3%; TLS 1.0 offering 63.8%; n=18,958Indonesia 63.8%97.3%China: TLS 1.3 adoption 77.5%; TLS 1.0 offering 44.6%; n=26,213China 44.6%77.5%Ukraine: TLS 1.3 adoption 88.2%; TLS 1.0 offering 55.5%; n=6,709Ukraine 55.5%88.2%South Korea: TLS 1.3 adoption 69.1%; TLS 1.0 offering 36.7%; n=7,887South Korea 36.7%69.1%Thailand: TLS 1.3 adoption 93.5%; TLS 1.0 offering 63.4%; n=5,113Thailand 63.4%93.5%
TLS 1.3 adoptionTLS 1.0 offering

Countries with 2,000+ websites in the dataset

Denominator: deep-scanned websites · n per cohort in the table

View as table
CohortTLS 1.3 adoptionTLS 1.0 offeringn
United States92.8%22.4%129,602
United Kingdom95.1%44.2%46,178
Russia73.5%38%39,009
Germany92.8%16.4%39,996
China77.5%44.6%26,213
Japan77.3%21.7%27,058
Netherlands95.1%49.1%24,615
India89%26.6%23,180
Brazil90.6%35.1%21,812
France91.8%22.8%21,030
Indonesia97.3%63.8%18,958
Italy90.1%36%16,906
Canada92.8%26.4%13,809
Spain90.6%26.5%13,574
Poland90.7%30.3%12,320
Australia94.3%20.2%11,533
Turkey87.3%44.5%8,762
South Korea69.1%36.7%7,887
Czechia86.1%26.9%6,946
Ukraine88.2%55.5%6,709
Switzerland93.5%20.2%6,043
Iran90.8%26.4%5,804
Sweden91.8%27.3%5,306
Romania92.9%30.1%5,139
Thailand93.5%63.4%5,113
Belgium92%22%5,051
Austria92.1%18.3%4,787
Vietnam84.7%50.9%4,549
Mexico87.4%27.4%4,519
Greece92.3%41.8%4,431
Argentina87.7%33.1%4,190
Hungary88.1%28.5%3,817
Denmark91.7%20%3,546
South Africa92.4%27.5%3,377
Finland92%20.4%3,337
Taiwan76.7%30.5%3,159
Portugal88.7%28.8%3,008
Chile90.3%21.4%2,965
Pakistan94.1%25.2%2,944
Colombia88.9%23.6%2,770
Hong Kong88.2%29.9%2,730
Norway90.9%16.8%2,604
Malaysia86.9%33.2%2,484
Slovakia87.4%25.8%2,432
Israel93%31.5%2,396
Singapore91.8%30.9%2,405
United Arab Emirates90%27%2,256
Ireland90.3%19%2,216
New Zealand92.8%21.9%2,145
Bulgaria87.4%40.1%2,131
Other90.2%31.9%3,536
Unknown89.8%42.6%306,666
By region

Which regions lead?

Not affected by the filter above.

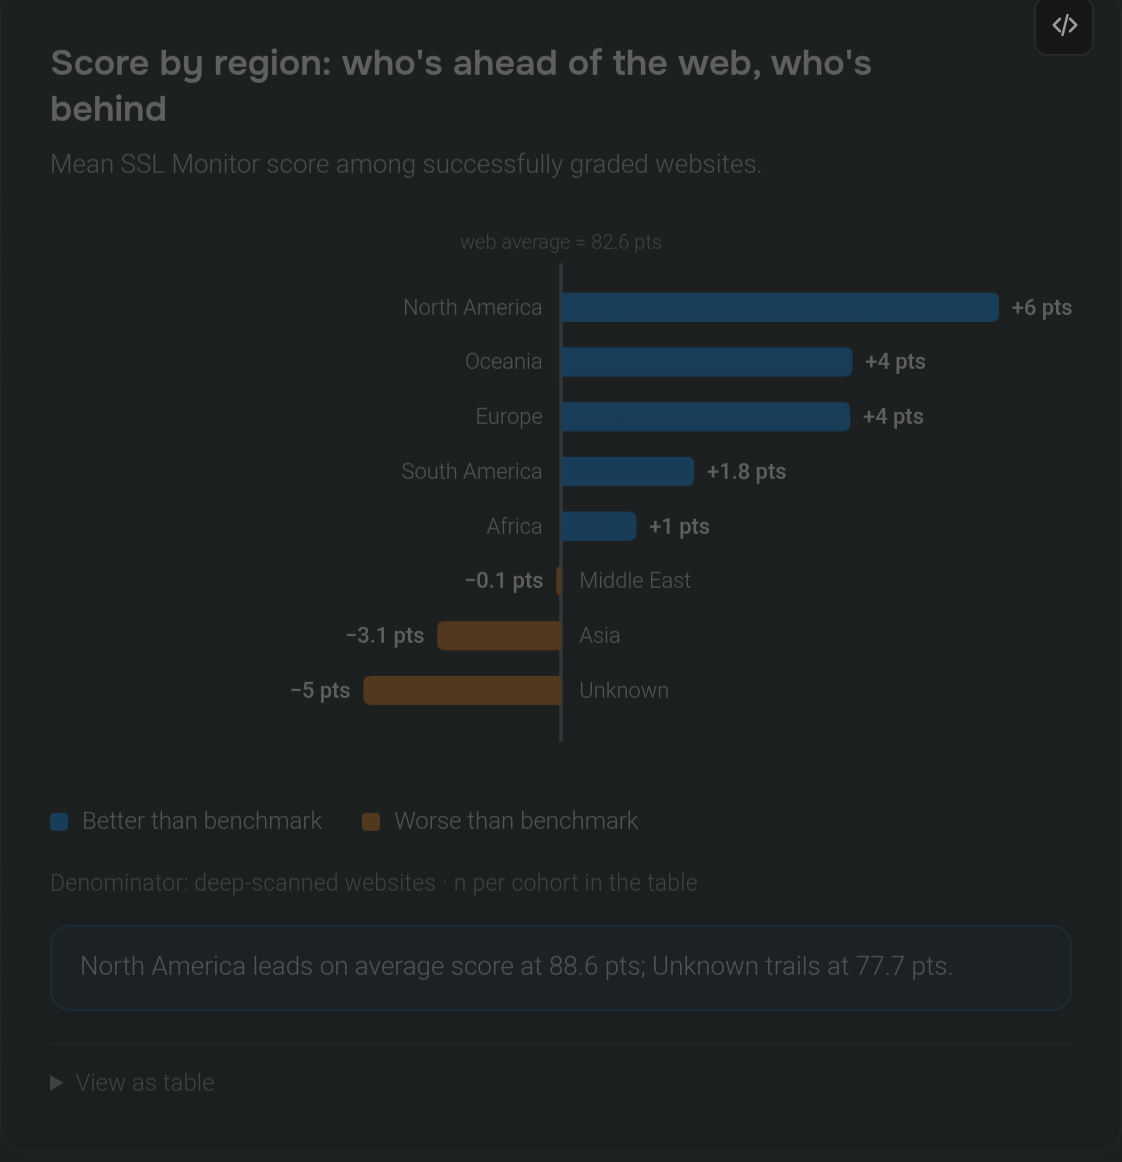
Score by region: who's ahead of the web, who's behind

Mean SSL Monitor score among successfully graded websites.

web average = 82.6 ptsNorth America: 88.6; +6 pts vs web average = 82.6 pts (better); n=150932 North America +6 ptsOceania: 86.6; +4 pts vs web average = 82.6 pts (better); n=14046 Oceania +4 ptsEurope: 86.6; +4 pts vs web average = 82.6 pts (better); n=259702 Europe +4 ptsSouth America: 84.5; +1.8 pts vs web average = 82.6 pts (better); n=35716 South America +1.8 ptsAfrica: 83.7; +1 pts vs web average = 82.6 pts (better); n=11155 Africa +1 ptsMiddle East: 82.5; −0.1 pts vs web average = 82.6 pts (worse); n=23432 Middle East −0.1 ptsAsia: 79.5; −3.1 pts vs web average = 82.6 pts (worse); n=174632 Asia −3.1 ptsUnknown: 77.7; −5 pts vs web average = 82.6 pts (worse); n=303815 Unknown −5 pts
Better than benchmarkWorse than benchmark

Denominator: deep-scanned websites · n per cohort in the table

North America leads on average score at 88.6 pts; Unknown trails at 77.7 pts.

View as table
SliceAverage scorevs benchmarkn
North America88.6 pts+6 pts150,932
Oceania86.6 pts+4 pts14,046
Europe86.6 pts+4 pts259,702
South America84.5 pts+1.8 pts35,716
Africa83.7 pts+1 pts11,155
Middle East82.5 pts−0.1 pts23,432
Asia79.5 pts−3.1 pts174,632
Unknown77.7 pts−5 pts303,815

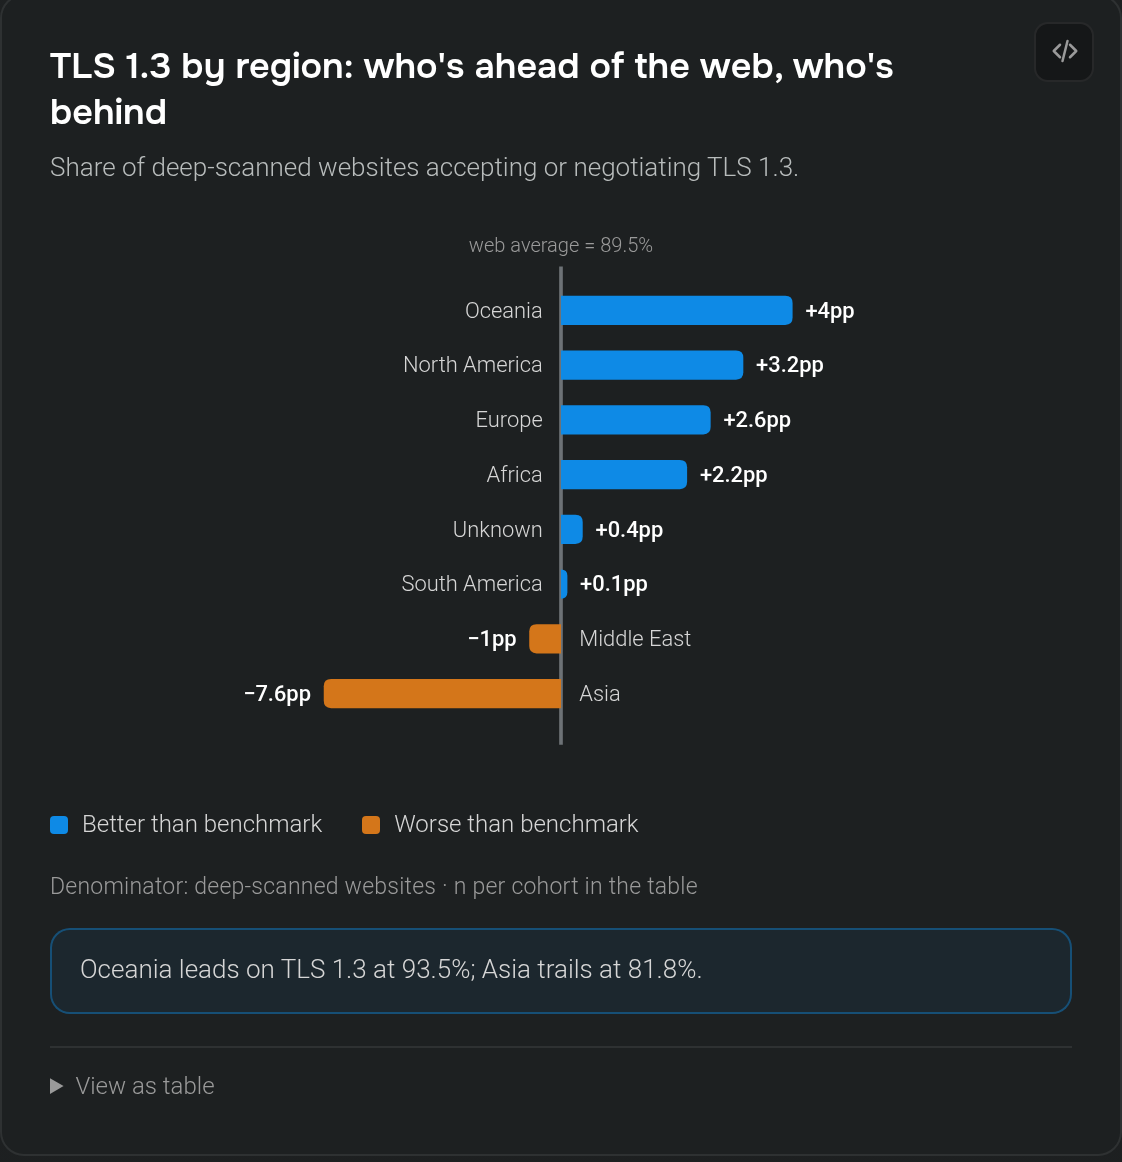
TLS 1.3 by region: who's ahead of the web, who's behind

Share of deep-scanned websites accepting or negotiating TLS 1.3.

web average = 89.5%Oceania: 93.5; +4pp vs web average = 89.5% (better); n=14046 Oceania +4ppNorth America: 92.6; +3.2pp vs web average = 89.5% (better); n=150932 North America +3.2ppEurope: 92.1; +2.6pp vs web average = 89.5% (better); n=259702 Europe +2.6ppAfrica: 91.7; +2.2pp vs web average = 89.5% (better); n=11155 Africa +2.2ppUnknown: 89.8; +0.4pp vs web average = 89.5% (better); n=303815 Unknown +0.4ppSouth America: 89.6; +0.1pp vs web average = 89.5% (better); n=35716 South America +0.1ppMiddle East: 88.4; −1pp vs web average = 89.5% (worse); n=23432 Middle East −1ppAsia: 81.8; −7.6pp vs web average = 89.5% (worse); n=174632 Asia −7.6pp
Better than benchmarkWorse than benchmark

Denominator: deep-scanned websites · n per cohort in the table

Oceania leads on TLS 1.3 at 93.5%; Asia trails at 81.8%.

View as table
SliceSharevs benchmarkn
Oceania93.5%+4pp14,046
North America92.6%+3.2pp150,932
Europe92.1%+2.6pp259,702
Africa91.7%+2.2pp11,155
Unknown89.8%+0.4pp303,815
South America89.6%+0.1pp35,716
Middle East88.4%−1pp23,432
Asia81.8%−7.6pp174,632

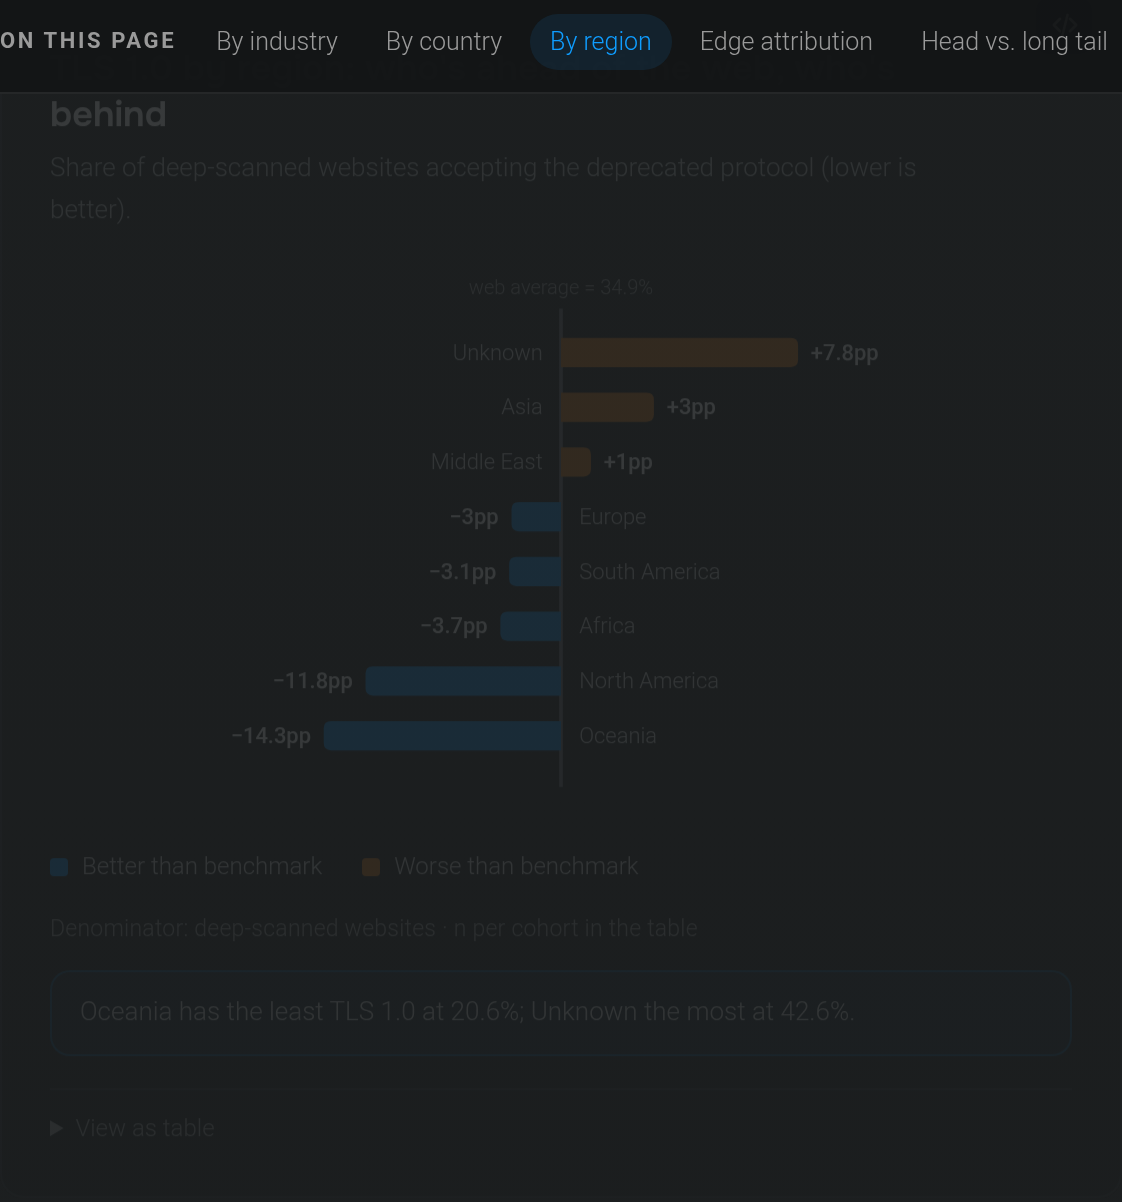
TLS 1.0 by region: who's ahead of the web, who's behind

Share of deep-scanned websites accepting the deprecated protocol (lower is better).

web average = 34.9%Unknown: 42.6; +7.8pp vs web average = 34.9% (worse); n=303815 Unknown +7.8ppAsia: 37.9; +3pp vs web average = 34.9% (worse); n=174632 Asia +3ppMiddle East: 35.9; +1pp vs web average = 34.9% (worse); n=23432 Middle East +1ppEurope: 31.9; −3pp vs web average = 34.9% (better); n=259702 Europe −3ppSouth America: 31.8; −3.1pp vs web average = 34.9% (better); n=35716 South America −3.1ppAfrica: 31.2; −3.7pp vs web average = 34.9% (better); n=11155 Africa −3.7ppNorth America: 23.1; −11.8pp vs web average = 34.9% (better); n=150932 North America −11.8ppOceania: 20.6; −14.3pp vs web average = 34.9% (better); n=14046 Oceania −14.3pp
Better than benchmarkWorse than benchmark

Denominator: deep-scanned websites · n per cohort in the table

Oceania has the least TLS 1.0 at 20.6%; Unknown the most at 42.6%.

View as table
SliceSharevs benchmarkn
Unknown42.6%+7.8pp303,815
Asia37.9%+3pp174,632
Middle East35.9%+1pp23,432
Europe31.9%−3pp259,702
South America31.8%−3.1pp35,716
Africa31.2%−3.7pp11,155
North America23.1%−11.8pp150,932
Oceania20.6%−14.3pp14,046

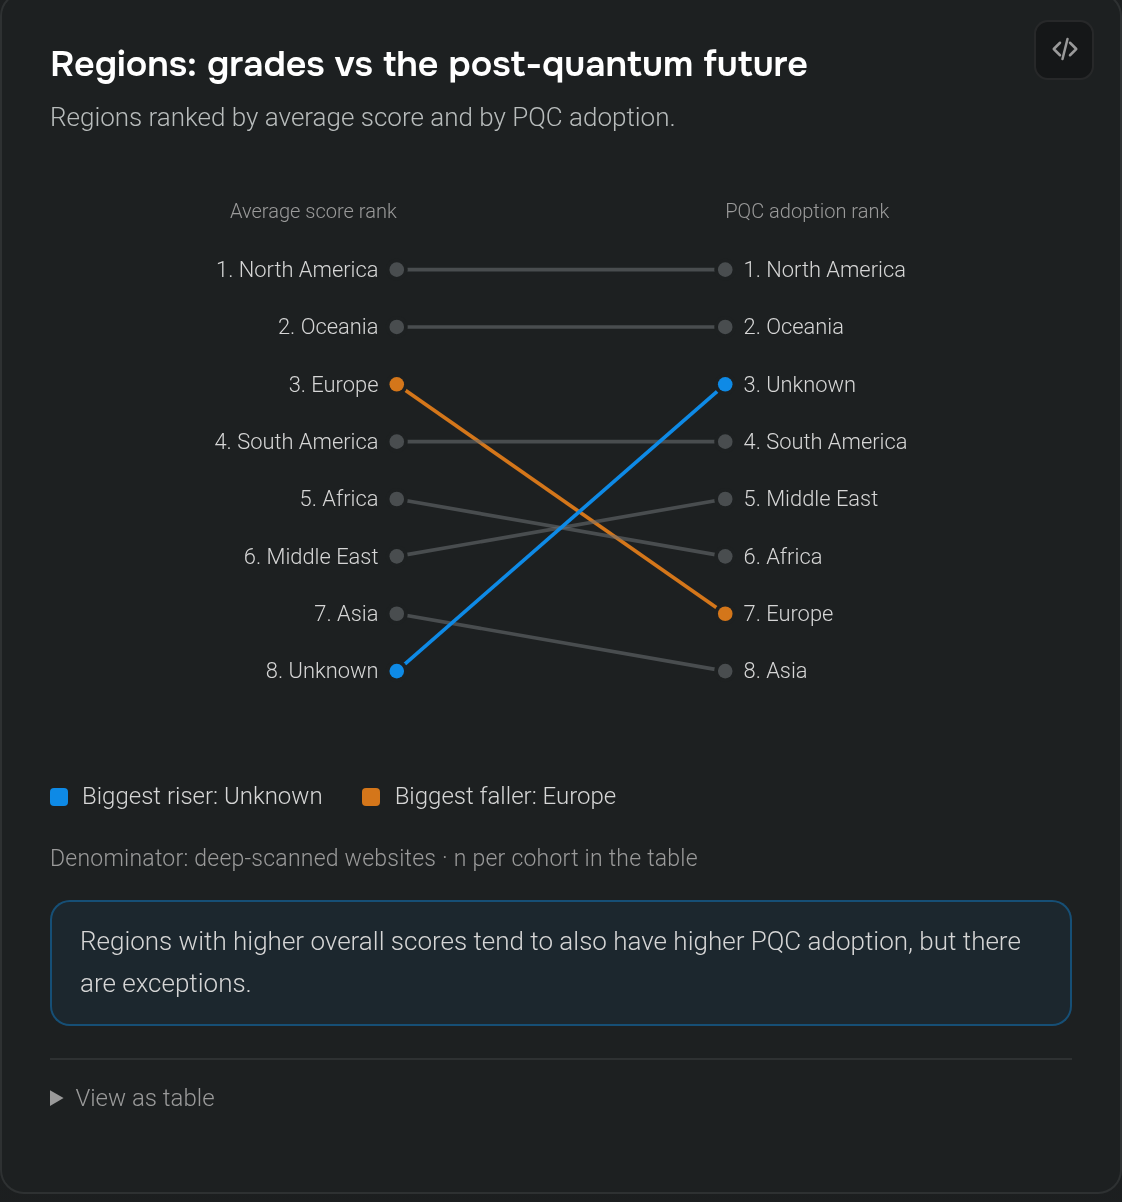
Regions: grades vs the post-quantum future

Regions ranked by average score and by PQC adoption.

Average score rankPQC adoption rankNorth America: TLS score 88.6 pts, Post-quantum key exchange 74.2%, n=150,932 1. North America 1. North AmericaOceania: TLS score 86.6 pts, Post-quantum key exchange 71.5%, n=14,046 2. Oceania 2. OceaniaEurope: TLS score 86.6 pts, Post-quantum key exchange 59.5%, n=259,702 3. Europe 7. EuropeSouth America: TLS score 84.5 pts, Post-quantum key exchange 60.9%, n=35,716 4. South America 4. South AmericaAfrica: TLS score 83.7 pts, Post-quantum key exchange 60.5%, n=11,155 5. Africa 6. AfricaMiddle East: TLS score 82.5 pts, Post-quantum key exchange 60.6%, n=23,432 6. Middle East 5. Middle EastAsia: TLS score 79.5 pts, Post-quantum key exchange 45.4%, n=174,632 7. Asia 8. AsiaUnknown: TLS score 77.7 pts, Post-quantum key exchange 65.3%, n=303,815 8. Unknown 3. Unknown
Biggest riser: UnknownBiggest faller: Europe

Denominator: deep-scanned websites · n per cohort in the table

Regions with higher overall scores tend to also have higher PQC adoption, but there are exceptions.

View as table
CohortAverage score rankPQC adoption rankn
North America11150,932
South America4435,716
Europe37259,702
Asia78174,632
Middle East6523,432
Africa5611,155
Oceania2214,046
Unknown83303,815
Edge attribution

How much of the web's TLS posture is five companies' config?

A handful of edge providers have an outsized impact on tech adoption

Not affected by the filter above.

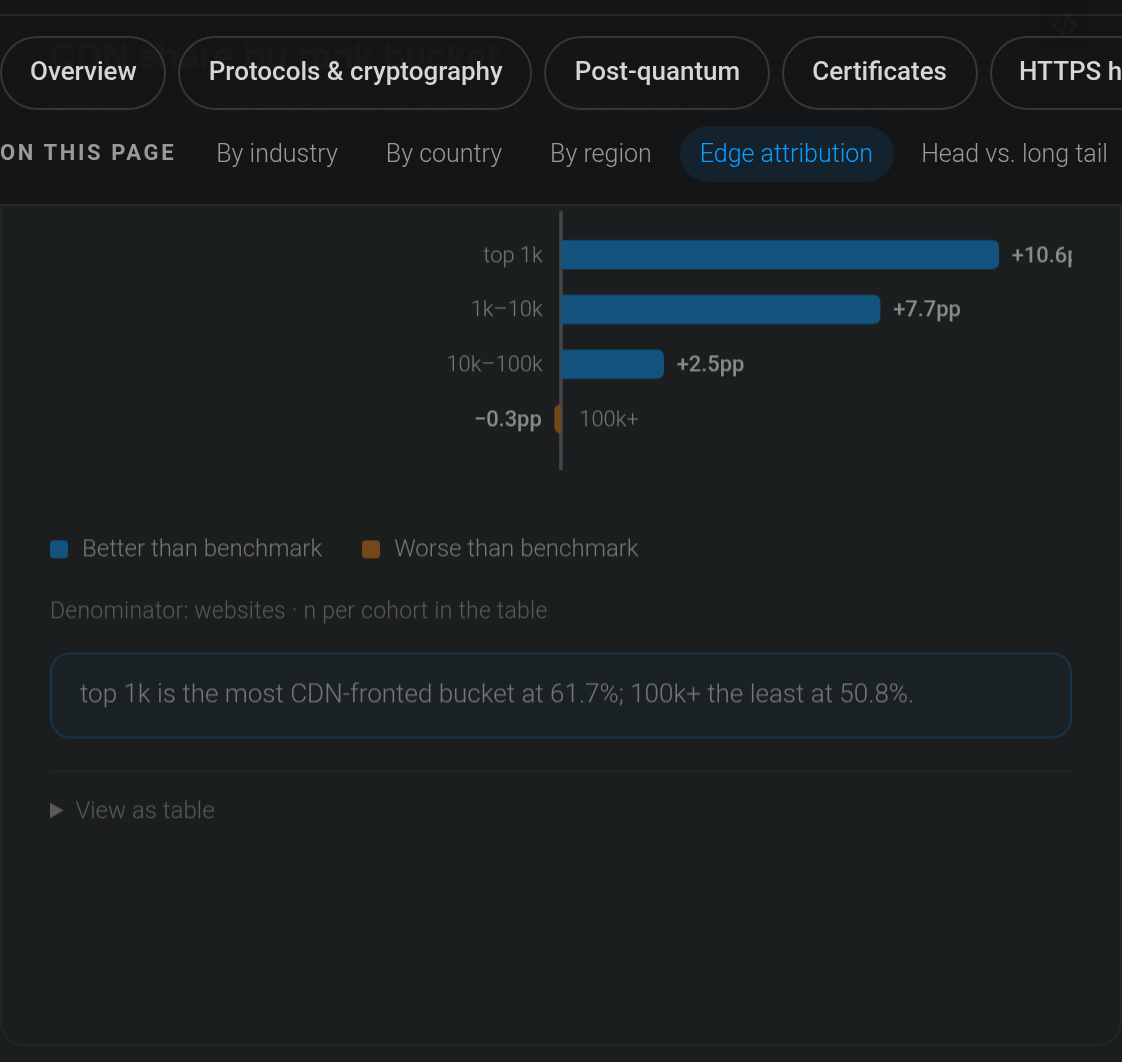
CDN share by rank bucket

Share of websites fronted by an identified edge provider, per Tranco rank bucket.

web average = 51.1%top 1k: 61.7; +10.6pp vs web average = 51.1% (better); n=781 top 1k +10.6pp1k–10k: 58.9; +7.7pp vs web average = 51.1% (better); n=7514 1k–10k +7.7pp10k–100k: 53.6; +2.5pp vs web average = 51.1% (better); n=77557 10k–100k +2.5pp100k+: 50.8; −0.3pp vs web average = 51.1% (worse); n=914148 100k+ −0.3pp
Better than benchmarkWorse than benchmark

Denominator: websites · n per cohort in the table

top 1k is the most CDN-fronted bucket at 61.7%; 100k+ the least at 50.8%.

View as table
SliceSharevs benchmarkn
top 1k61.7%+10.6pp781
1k–10k58.9%+7.7pp7,514
10k–100k53.6%+2.5pp77,557
100k+50.8%−0.3pp914,148

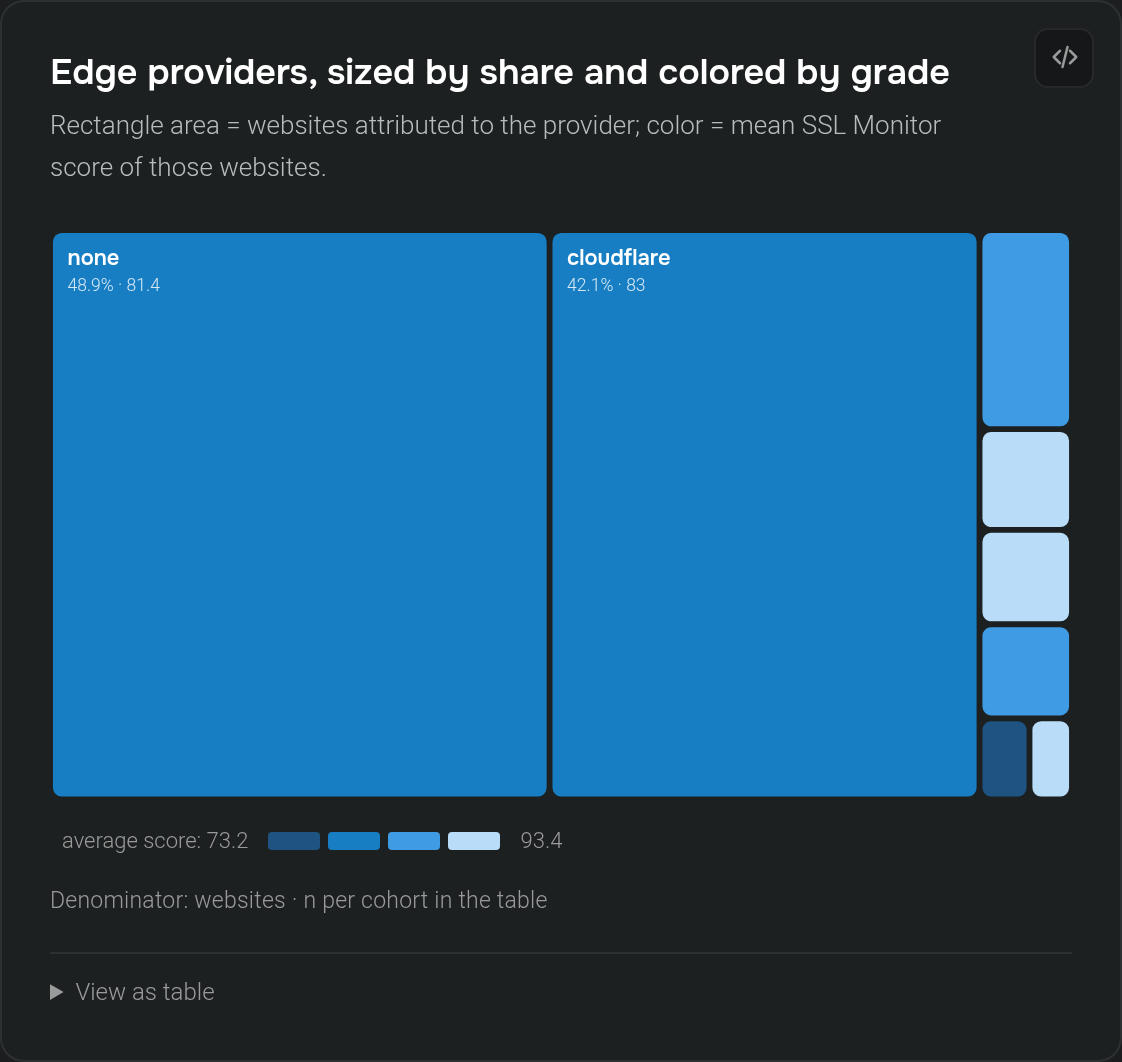
Edge providers, sized by share and colored by grade

Rectangle area = websites attributed to the provider; color = mean SSL Monitor score of those websites.

none: 488,816 websites; average score 81.4 none48.9% · 81.4cloudflare: 420,717 websites; average score 83 cloudflare42.1% · 83other-cdn: 31,639 websites; average score 86.5 akamai: 16,020 websites; average score 89 fastly: 14,984 websites; average score 93.4 azure-front-door: 14,942 websites; average score 86 google: 6,961 websites; average score 73.2 cloudfront: 5,921 websites; average score 92.5
average score: 73.293.4

Denominator: websites · n per cohort in the table

View as table
CohortSitesShareaverage score
cloudflare420,71742.1%83
akamai16,0201.6%89
fastly14,9841.5%93.4
cloudfront5,9210.6%92.5
google6,9610.7%73.2
azure-front-door14,9421.5%86
other-cdn31,6393.2%86.5
none488,81648.9%81.4

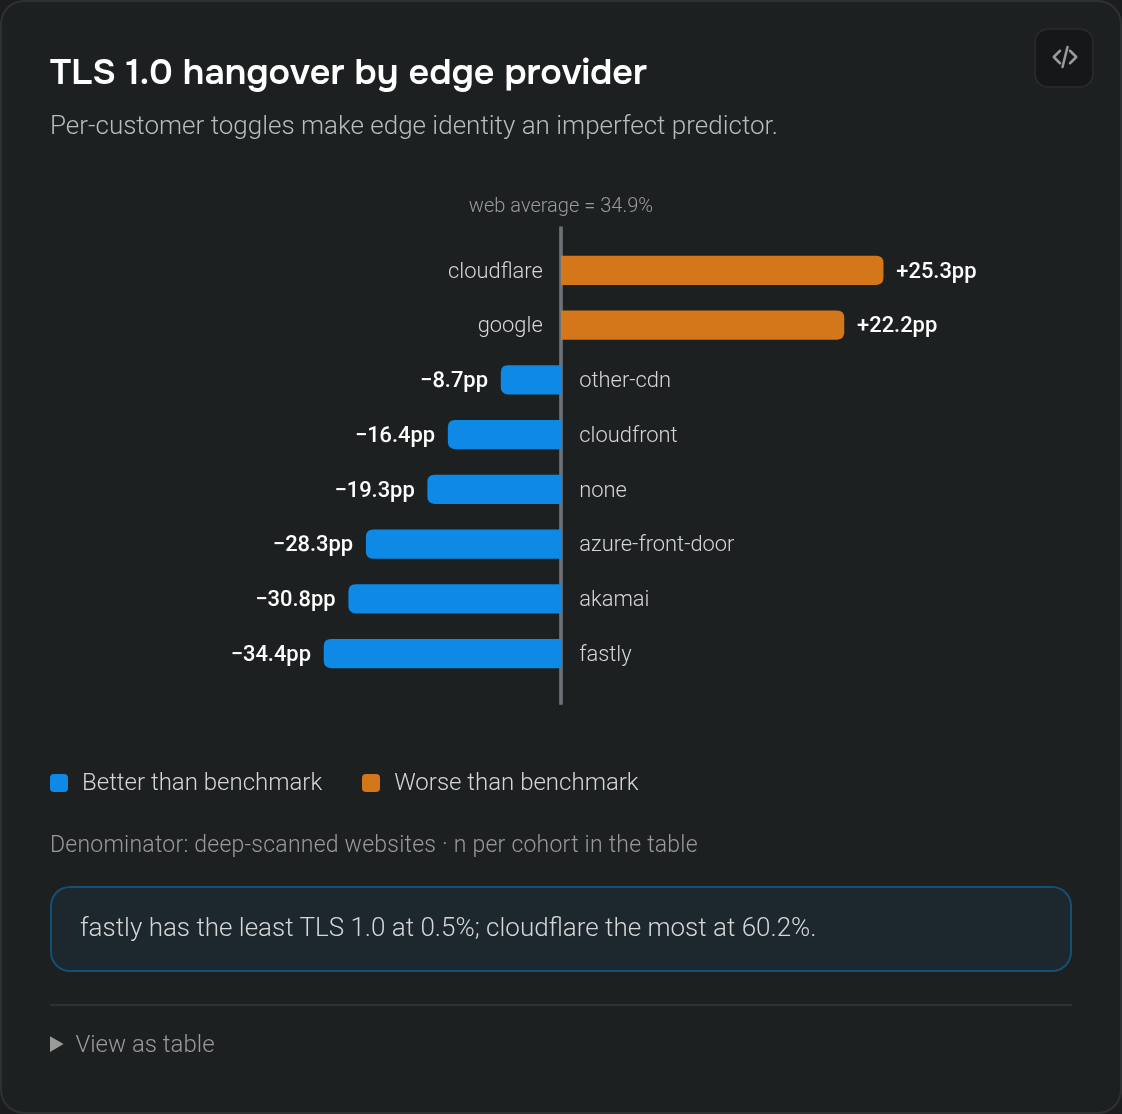
TLS 1.0 hangover by edge provider

Per-customer toggles make edge identity an imperfect predictor.

web average = 34.9%cloudflare: 60.2; +25.3pp vs web average = 34.9% (worse); n=419551 cloudflare +25.3ppgoogle: 57.1; +22.2pp vs web average = 34.9% (worse); n=6802 google +22.2ppother-cdn: 26.2; −8.7pp vs web average = 34.9% (better); n=31530 other-cdn −8.7ppcloudfront: 18.5; −16.4pp vs web average = 34.9% (better); n=5920 cloudfront −16.4ppnone: 15.6; −19.3pp vs web average = 34.9% (better); n=463955 none −19.3ppazure-front-door: 6.6; −28.3pp vs web average = 34.9% (better); n=14773 azure-front-door −28.3ppakamai: 4.1; −30.8pp vs web average = 34.9% (better); n=15946 akamai −30.8ppfastly: 0.5; −34.4pp vs web average = 34.9% (better); n=14964 fastly −34.4pp
Better than benchmarkWorse than benchmark

Denominator: deep-scanned websites · n per cohort in the table

fastly has the least TLS 1.0 at 0.5%; cloudflare the most at 60.2%.

View as table
SliceSharevs benchmarkn
cloudflare60.2%+25.3pp419,551
google57.1%+22.2pp6,802
other-cdn26.2%−8.7pp31,530
cloudfront18.5%−16.4pp5,920
none15.6%−19.3pp463,955
azure-front-door6.6%−28.3pp14,773
akamai4.1%−30.8pp15,946
fastly0.5%−34.4pp14,964
Head vs. long tail

The top 1,000 vs. everyone else

Not affected by the filter above.

The top 1,000 vs. the long tail

Same crawl, split by Tranco rank bucket. Share measures on a 0–100 scale; the score in points.

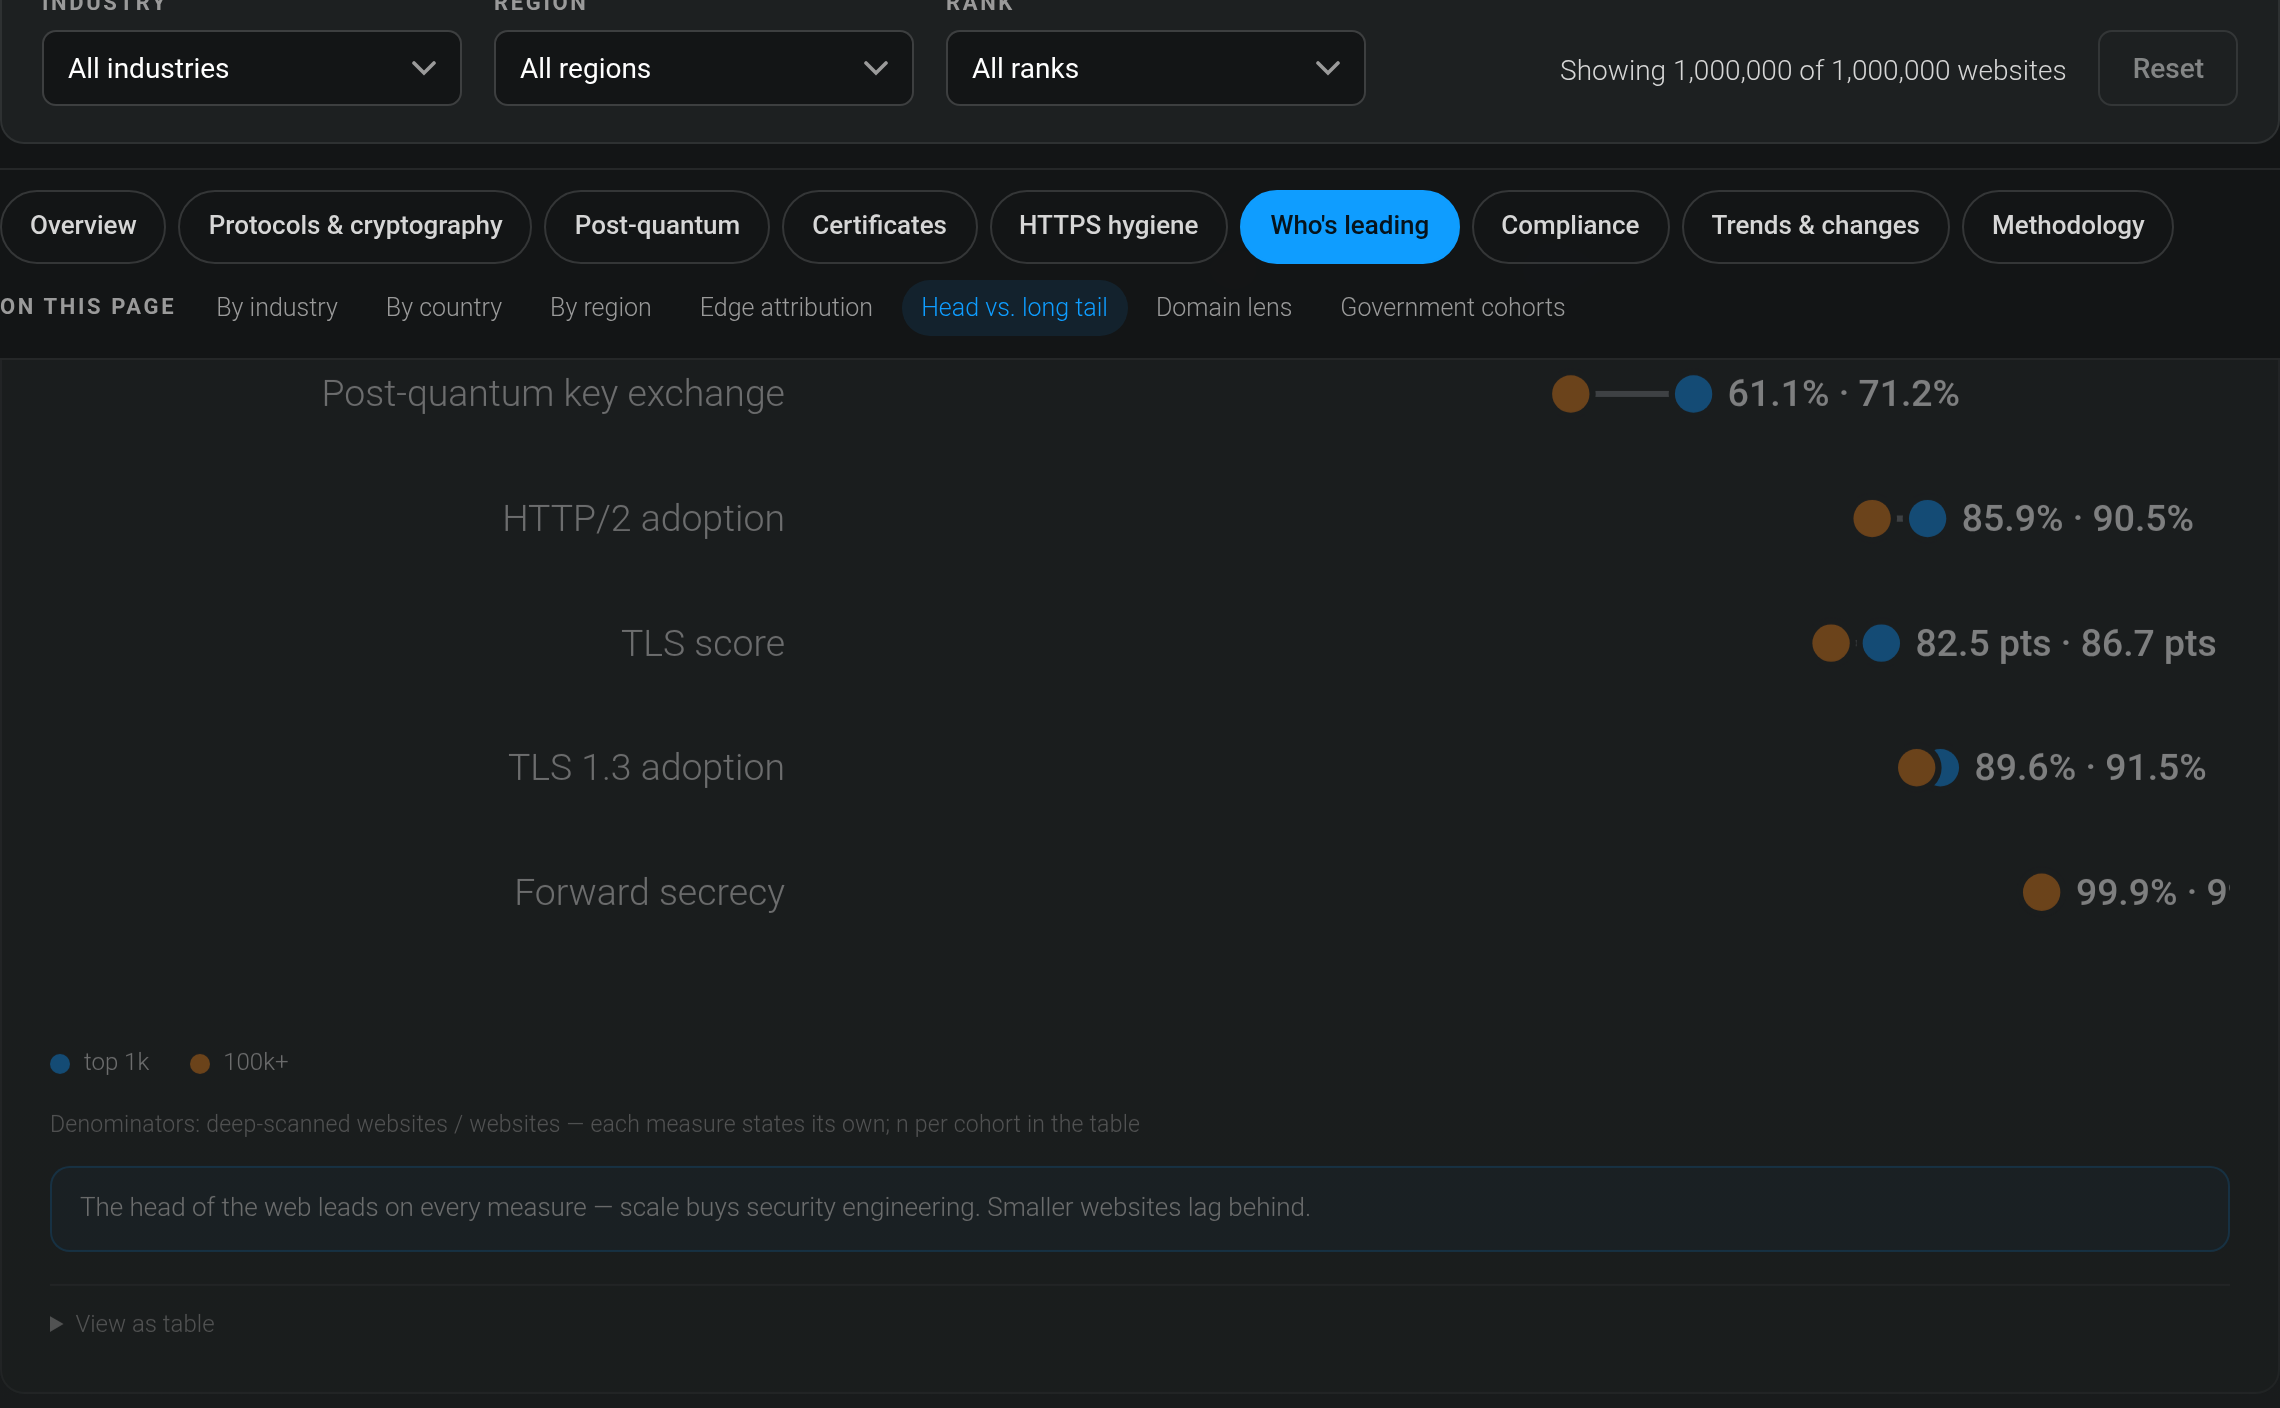
HSTS adoption: top 1k 59.5%; 100k+ 33.5%HSTS adoption 33.5%59.5%Post-quantum key exchange: top 1k 71.2%; 100k+ 61.1%Post-quantum key exchange 61.1% · 71.2%HTTP/2 adoption: top 1k 90.5%; 100k+ 85.9%HTTP/2 adoption 85.9% · 90.5%TLS score: top 1k 86.7 pts; 100k+ 82.5 ptsTLS score 82.5 pts · 86.7 ptsTLS 1.3 adoption: top 1k 91.5%; 100k+ 89.6%TLS 1.3 adoption 89.6% · 91.5%Forward secrecy: top 1k 99.9%; 100k+ 99.9%Forward secrecy 99.9% · 99.9%
top 1k100k+

Denominators: deep-scanned websites / websites — each measure states its own; n per cohort in the table

The head of the web leads on every measure — scale buys security engineering. Smaller websites lag behind.

View as table
Rowtop 1k100k+
TLS 1.3 adoption91.5%89.6%
Post-quantum key exchange71.2%61.1%
HSTS adoption59.5%33.5%
Forward secrecy99.9%99.9%
HTTP/2 adoption90.5%85.9%
TLS score86.7 pts82.5 pts
Domain lens

The top-level domains behind the traffic

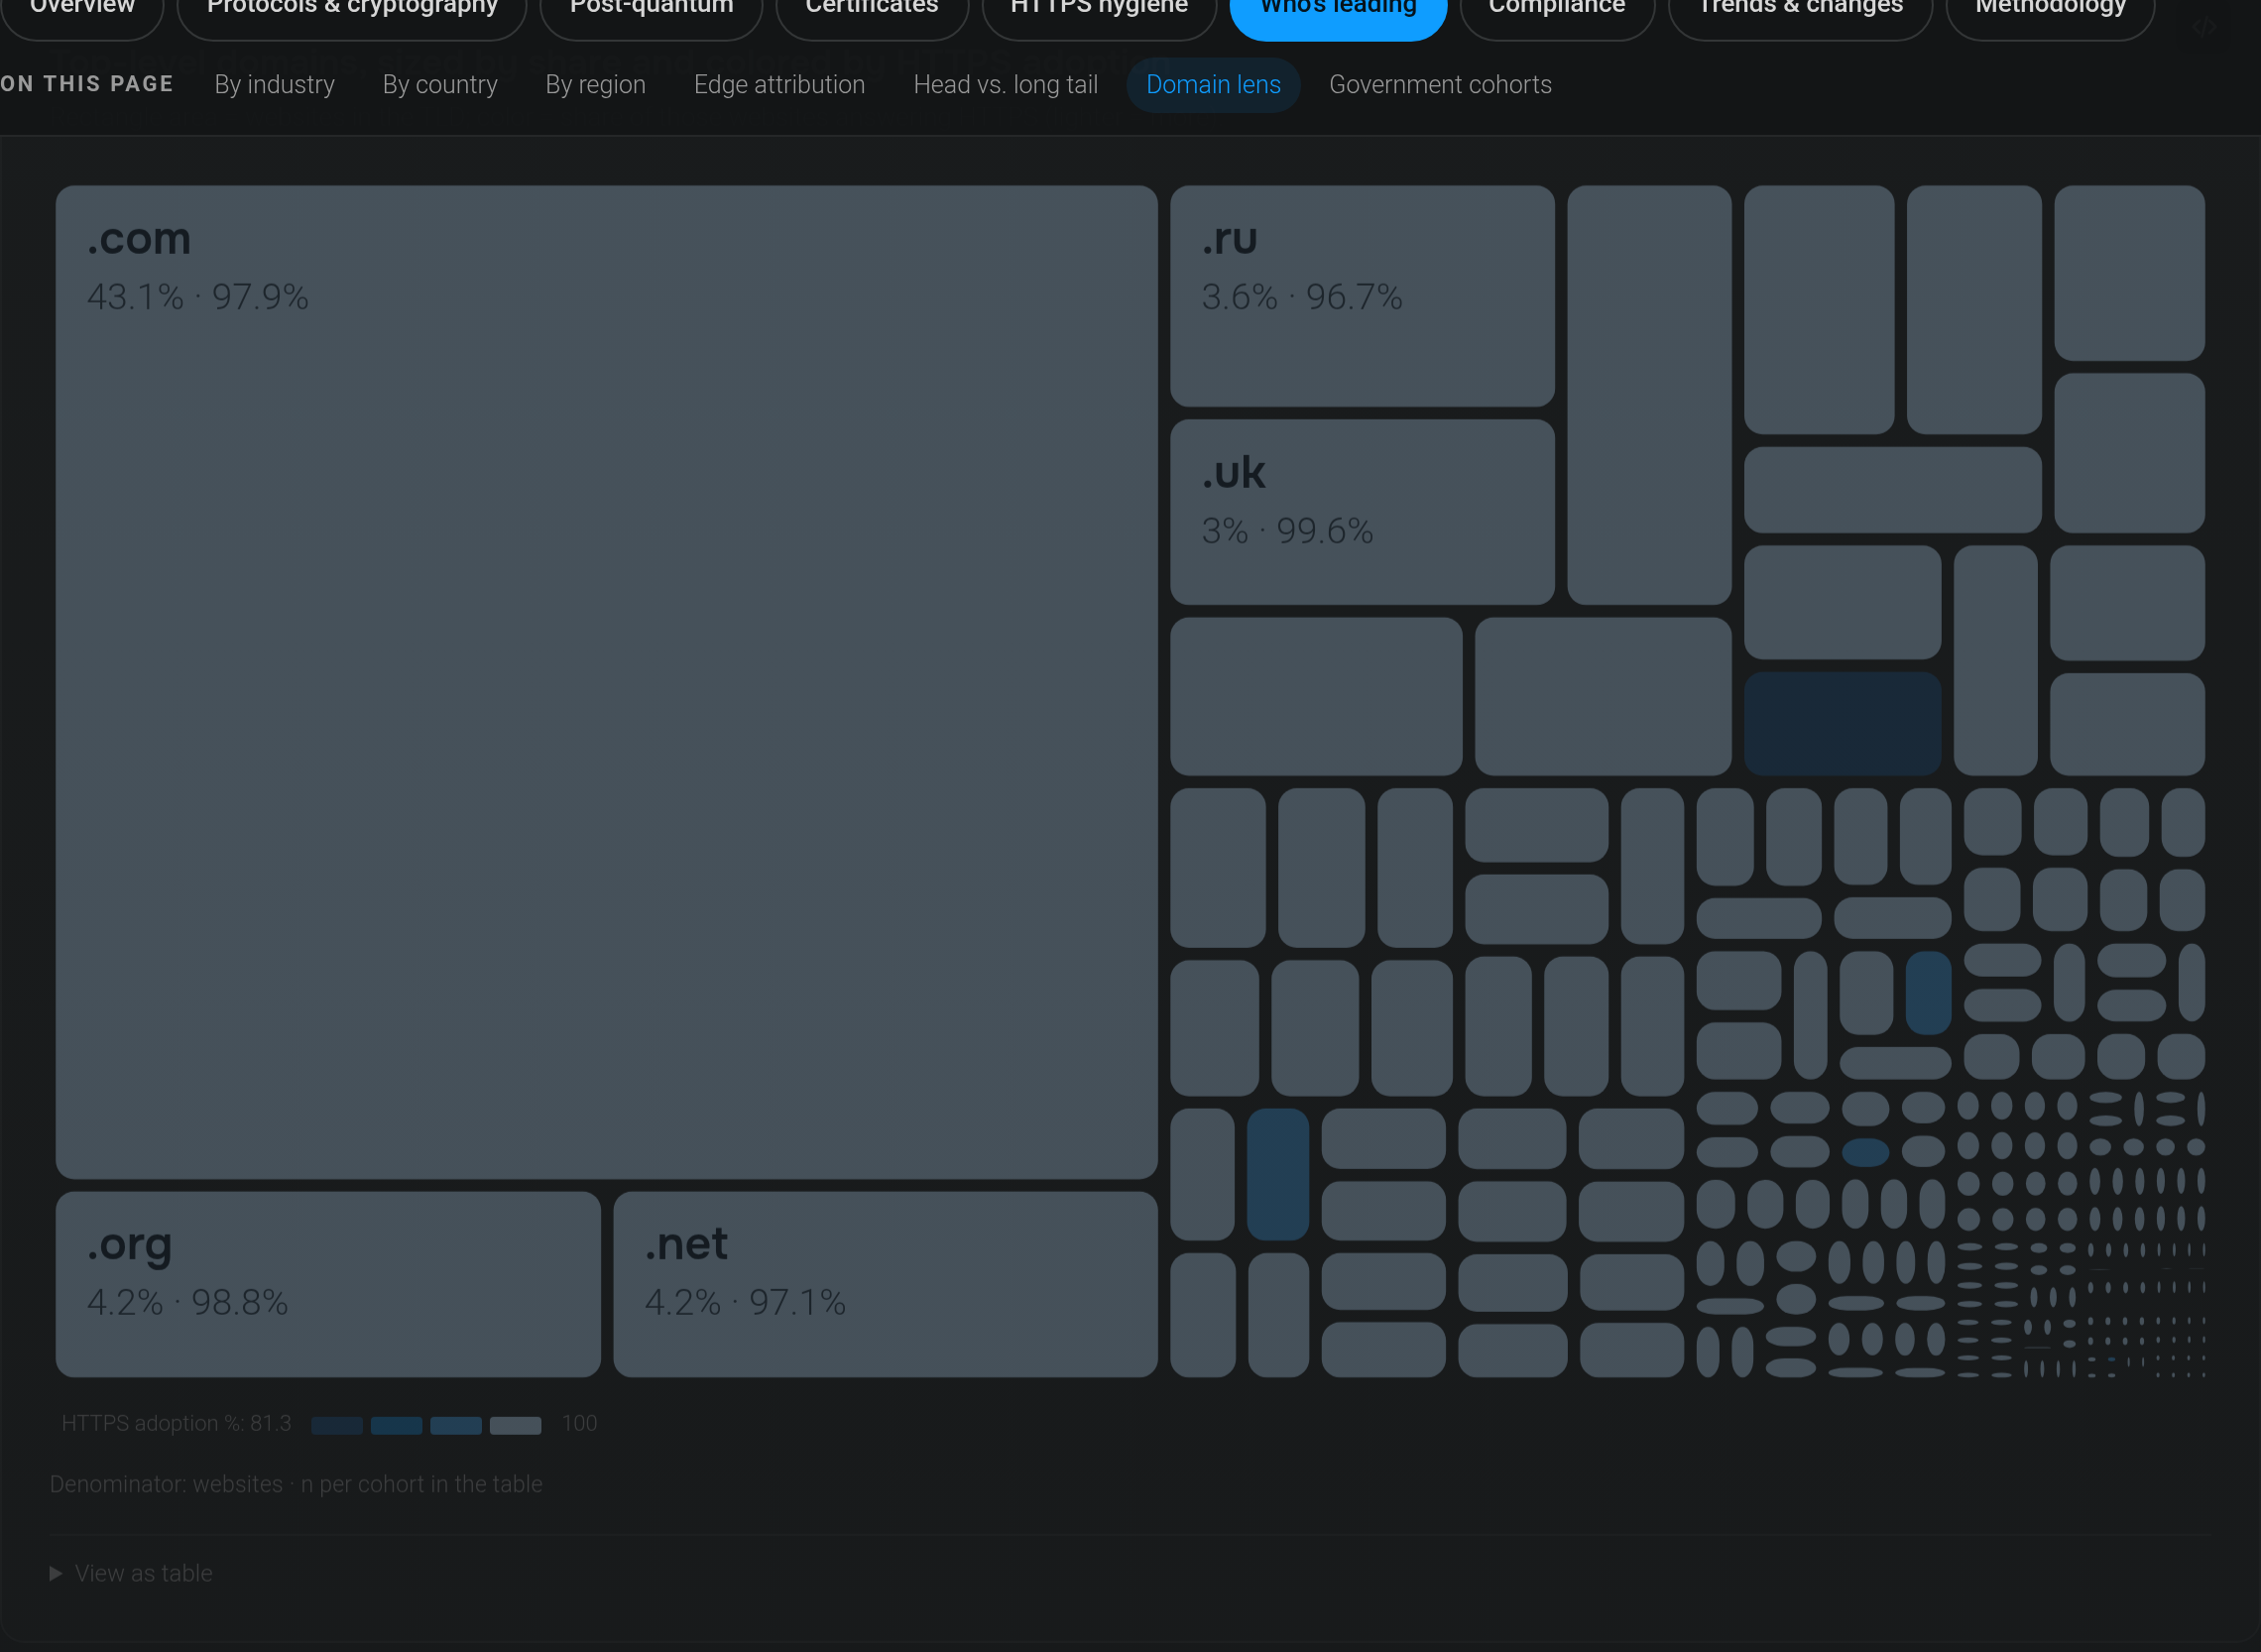
The twelve most common TLDs in the report, sized by how many websites they hold and colored by how many of those answer HTTPS.

Not affected by the filter above.

Top-level domains, sized by share and colored by HTTPS adoption

Rectangle area = websites in the TLD; color = share of those websites answering HTTPS (lighter = more).

.com: 430,738 websites; HTTPS adoption % 97.9% .com43.1% · 97.9%.org: 42,469 websites; HTTPS adoption % 98.8% .org4.2% · 98.8%.net: 42,408 websites; HTTPS adoption % 97.1% .net4.2% · 97.1%.ru: 35,662 websites; HTTPS adoption % 96.7% .ru3.6% · 96.7%.uk: 30,212 websites; HTTPS adoption % 99.6% .uk3% · 99.6%.de: 29,333 websites; HTTPS adoption % 99.5% .nl: 19,977 websites; HTTPS adoption % 99.8% .br: 17,645 websites; HTTPS adoption % 99.1% .jp: 16,330 websites; HTTPS adoption % 98.4% Other: 14,798 websites; HTTPS adoption % 98.7% .it: 11,765 websites; HTTPS adoption % 99.4% .in: 11,762 websites; HTTPS adoption % 98.4% .fr: 10,788 websites; HTTPS adoption % 99.3% .pl: 10,175 websites; HTTPS adoption % 99.4% .cn: 9,360 websites; HTTPS adoption % 81.3% .io: 8,972 websites; HTTPS adoption % 99.5% .au: 8,208 websites; HTTPS adoption % 99.6% .cc: 7,386 websites; HTTPS adoption % 98.7% .co: 7,131 websites; HTTPS adoption % 98.7% .ca: 6,564 websites; HTTPS adoption % 99.2% .eu: 5,793 websites; HTTPS adoption % 99% .es: 5,763 websites; HTTPS adoption % 99.3% .cz: 5,693 websites; HTTPS adoption % 99.1% .xyz: 5,348 websites; HTTPS adoption % 97.9% .ua: 5,169 websites; HTTPS adoption % 99% .id: 4,908 websites; HTTPS adoption % 99.4% .info: 4,888 websites; HTTPS adoption % 97.8% .kr: 4,609 websites; HTTPS adoption % 97.5% .ro: 4,483 websites; HTTPS adoption % 99.4% .online: 4,410 websites; HTTPS adoption % 97.6% .us: 4,254 websites; HTTPS adoption % 97.9% .shop: 4,140 websites; HTTPS adoption % 95.2% .ch: 4,094 websites; HTTPS adoption % 99.4% .se: 3,854 websites; HTTPS adoption % 99.6% .ai: 3,817 websites; HTTPS adoption % 99.6% .gr: 3,763 websites; HTTPS adoption % 99.6% .app: 3,637 websites; HTTPS adoption % 99.3% .be: 3,550 websites; HTTPS adoption % 99.5% .ar: 3,372 websites; HTTPS adoption % 99.1% .mx: 3,366 websites; HTTPS adoption % 98.6% .site: 3,306 websites; HTTPS adoption % 98% .at: 3,283 websites; HTTPS adoption % 99.2% .hu: 3,267 websites; HTTPS adoption % 99.2% .edu: 3,079 websites; HTTPS adoption % 99.7% .top: 3,068 websites; HTTPS adoption % 96.8% .tr: 3,001 websites; HTTPS adoption % 98.5% .me: 2,942 websites; HTTPS adoption % 98.8% .ir: 2,869 websites; HTTPS adoption % 98.7% .za: 2,805 websites; HTTPS adoption % 98.9% .tw: 2,755 websites; HTTPS adoption % 96.8% .vn: 2,690 websites; HTTPS adoption % 98.7% .cl: 2,686 websites; HTTPS adoption % 99.6% .tv: 2,663 websites; HTTPS adoption % 98.4% .dk: 2,592 websites; HTTPS adoption % 99.3% .pro: 2,483 websites; HTTPS adoption % 97.2% .fi: 2,431 websites; HTTPS adoption % 99.6% .vip: 2,146 websites; HTTPS adoption % 91.1% .sk: 2,138 websites; HTTPS adoption % 99.7% .pt: 2,135 websites; HTTPS adoption % 99.3% .live: 2,017 websites; HTTPS adoption % 98.9% .no: 2,006 websites; HTTPS adoption % 99.8% .gov: 1,958 websites; HTTPS adoption % 99.7% .biz: 1,917 websites; HTTPS adoption % 97.3% .pk: 1,747 websites; HTTPS adoption % 99.5% .nz: 1,699 websites; HTTPS adoption % 99.6% .il: 1,651 websites; HTTPS adoption % 99.2% .cloud: 1,569 websites; HTTPS adoption % 99.7% .my: 1,554 websites; HTTPS adoption % 98.4% .kz: 1,516 websites; HTTPS adoption % 99.3% .casino: 1,505 websites; HTTPS adoption % 98.1% .ie: 1,454 websites; HTTPS adoption % 99.5% .store: 1,443 websites; HTTPS adoption % 98.1% .club: 1,376 websites; HTTPS adoption % 98.4% .dev: 1,352 websites; HTTPS adoption % 97.6% .ph: 1,339 websites; HTTPS adoption % 98.7% .bg: 1,338 websites; HTTPS adoption % 99.3% .by: 1,284 websites; HTTPS adoption % 98.9% .hr: 1,210 websites; HTTPS adoption % 99.8% .space: 1,210 websites; HTTPS adoption % 97.4% .pe: 1,207 websites; HTTPS adoption % 98.6% .lt: 1,197 websites; HTTPS adoption % 99.3% .tech: 1,137 websites; HTTPS adoption % 97% .rs: 1,089 websites; HTTPS adoption % 99.4% .click: 1,072 websites; HTTPS adoption % 98% .su: 936 websites; HTTPS adoption % 95% .hk: 934 websites; HTTPS adoption % 98.1% .th: 932 websites; HTTPS adoption % 98.9% .fun: 923 websites; HTTPS adoption % 97.7% .buzz: 916 websites; HTTPS adoption % 97.6% .lv: 903 websites; HTTPS adoption % 98.7% .ee: 880 websites; HTTPS adoption % 99.7% .si: 875 websites; HTTPS adoption % 99.9% .lol: 873 websites; HTTPS adoption % 96.6% .sg: 858 websites; HTTPS adoption % 99.4% .one: 854 websites; HTTPS adoption % 98.7% .gg: 853 websites; HTTPS adoption % 99.6% .to: 823 websites; HTTPS adoption % 97.9% .ae: 762 websites; HTTPS adoption % 99.5% .win: 757 websites; HTTPS adoption % 98.7% .ng: 723 websites; HTTPS adoption % 99.7% .link: 711 websites; HTTPS adoption % 98.9% .bd: 701 websites; HTTPS adoption % 98.9% .icu: 655 websites; HTTPS adoption % 98.5% .uz: 633 websites; HTTPS adoption % 99.4% .blog: 629 websites; HTTPS adoption % 96.2% .xn--p1ai: 578 websites; HTTPS adoption % 97.8% .bet: 575 websites; HTTPS adoption % 99.5% .az: 566 websites; HTTPS adoption % 99.6% .life: 552 websites; HTTPS adoption % 99.3% .mobi: 529 websites; HTTPS adoption % 98.5% .lk: 521 websites; HTTPS adoption % 99.8% .sa: 519 websites; HTTPS adoption % 99.2% .ec: 518 websites; HTTPS adoption % 99.2% .ke: 518 websites; HTTPS adoption % 99.2% .games: 508 websites; HTTPS adoption % 98.4% .ma: 504 websites; HTTPS adoption % 99% .news: 502 websites; HTTPS adoption % 99.4% .asia: 493 websites; HTTPS adoption % 97% .sbs: 488 websites; HTTPS adoption % 99% .uy: 486 websites; HTTPS adoption % 98.8% .ge: 473 websites; HTTPS adoption % 99.2% .is: 469 websites; HTTPS adoption % 99.4% .cfd: 449 websites; HTTPS adoption % 99.1% .md: 444 websites; HTTPS adoption % 99.3% .cat: 441 websites; HTTPS adoption % 99.3% .wiki: 434 websites; HTTPS adoption % 98.4% .world: 433 websites; HTTPS adoption % 99.5% .network: 404 websites; HTTPS adoption % 99.5% .media: 395 websites; HTTPS adoption % 99.2% .website: 391 websites; HTTPS adoption % 97.7% .work: 385 websites; HTTPS adoption % 97.7% .am: 372 websites; HTTPS adoption % 100% .art: 371 websites; HTTPS adoption % 98.7% .cyou: 363 websites; HTTPS adoption % 98.6% .lat: 361 websites; HTTPS adoption % 97% .digital: 352 websites; HTTPS adoption % 98.6% .ba: 347 websites; HTTPS adoption % 100% .ink: 345 websites; HTTPS adoption % 97.4% .fm: 342 websites; HTTPS adoption % 99.1% .today: 322 websites; HTTPS adoption % 99.1% .ws: 320 websites; HTTPS adoption % 97.5% .py: 305 websites; HTTPS adoption % 99.7% .im: 303 websites; HTTPS adoption % 99.7% .team: 299 websites; HTTPS adoption % 98.7% .kg: 296 websites; HTTPS adoption % 100% .tn: 294 websites; HTTPS adoption % 97.3% .nu: 292 websites; HTTPS adoption % 98.3% .eg: 288 websites; HTTPS adoption % 96.9% .mk: 286 websites; HTTPS adoption % 98.3% .do: 281 websites; HTTPS adoption % 100% .global: 276 websites; HTTPS adoption % 98.9% .lu: 268 websites; HTTPS adoption % 99.3% .pw: 268 websites; HTTPS adoption % 97.8% .social: 268 websites; HTTPS adoption % 99.6% .xxx: 263 websites; HTTPS adoption % 99.6% .host: 261 websites; HTTPS adoption % 100% .np: 258 websites; HTTPS adoption % 97.3% .chat: 249 websites; HTTPS adoption % 98.4% .run: 245 websites; HTTPS adoption % 98.8% .sh: 243 websites; HTTPS adoption % 99.6% .fit: 240 websites; HTTPS adoption % 99.2% .cam: 239 websites; HTTPS adoption % 99.2% .gt: 239 websites; HTTPS adoption % 99.6% .cr: 236 websites; HTTPS adoption % 99.6% .name: 231 websites; HTTPS adoption % 98.3% .tz: 230 websites; HTTPS adoption % 99.1% .video: 229 websites; HTTPS adoption % 99.1% .st: 227 websites; HTTPS adoption % 98.2% .ve: 226 websites; HTTPS adoption % 96% .game: 224 websites; HTTPS adoption % 100% .la: 218 websites; HTTPS adoption % 98.6% .best: 215 websites; HTTPS adoption % 97.7% .travel: 213 websites; HTTPS adoption % 100% .bo: 202 websites; HTTPS adoption % 98% .cy: 197 websites; HTTPS adoption % 99.5% .mom: 196 websites; HTTPS adoption % 98% .plus: 192 websites; HTTPS adoption % 100% .al: 184 websites; HTTPS adoption % 99.5% .guru: 184 websites; HTTPS adoption % 100% .group: 179 websites; HTTPS adoption % 96.6% .pics: 179 websites; HTTPS adoption % 98.9% .zone: 179 websites; HTTPS adoption % 98.9% .so: 176 websites; HTTPS adoption % 98.9% .monster: 174 websites; HTTPS adoption % 97.1% .bz: 173 websites; HTTPS adoption % 98.3% .mn: 172 websites; HTTPS adoption % 97.7% .moe: 161 websites; HTTPS adoption % 97.5% .dz: 160 websites; HTTPS adoption % 97.5% .ly: 160 websites; HTTPS adoption % 98.8% .help: 157 websites; HTTPS adoption % 98.1% .li: 157 websites; HTTPS adoption % 97.5% .ac: 155 websites; HTTPS adoption % 99.4% .love: 154 websites; HTTPS adoption % 100% .tools: 150 websites; HTTPS adoption % 98.7% .ug: 149 websites; HTTPS adoption % 100% .sv: 148 websites; HTTPS adoption % 98% .aero: 147 websites; HTTPS adoption % 98.6% .cx: 145 websites; HTTPS adoption % 97.9% .re: 142 websites; HTTPS adoption % 98.6% .city: 141 websites; HTTPS adoption % 97.9% .jo: 141 websites; HTTPS adoption % 97.9% .bio: 139 websites; HTTPS adoption % 99.3% .services: 139 websites; HTTPS adoption % 97.1% .watch: 135 websites; HTTPS adoption % 98.5% .qa: 134 websites; HTTPS adoption % 99.3% .studio: 134 websites; HTTPS adoption % 98.5% .coop: 133 websites; HTTPS adoption % 100% .ltd: 133 websites; HTTPS adoption % 97% .pa: 133 websites; HTTPS adoption % 99.2% .gh: 131 websites; HTTPS adoption % 99.2% .eus: 130 websites; HTTPS adoption % 99.2% .quest: 130 websites; HTTPS adoption % 97.7% .center: 126 websites; HTTPS adoption % 99.2% .stream: 125 websites; HTTPS adoption % 98.4% .tokyo: 124 websites; HTTPS adoption % 100% .baby: 123 websites; HTTPS adoption % 94.3% .rest: 123 websites; HTTPS adoption % 97.6% .wtf: 121 websites; HTTPS adoption % 100% .systems: 120 websites; HTTPS adoption % 97.5% .health: 119 websites; HTTPS adoption % 99.2% .page: 119 websites; HTTPS adoption % 100% .market: 116 websites; HTTPS adoption % 97.4% .tube: 113 websites; HTTPS adoption % 100% .hn: 111 websites; HTTPS adoption % 100% .bond: 109 websites; HTTPS adoption % 98.2% .design: 108 websites; HTTPS adoption % 98.1% .vc: 108 websites; HTTPS adoption % 100% .ag: 107 websites; HTTPS adoption % 99.1% .africa: 103 websites; HTTPS adoption % 100% .rocks: 103 websites; HTTPS adoption % 99% .fans: 102 websites; HTTPS adoption % 99% .fyi: 101 websites; HTTPS adoption % 100% .iq: 101 websites; HTTPS adoption % 100% .vu: 101 websites; HTTPS adoption % 99% .zw: 101 websites; HTTPS adoption % 99% .homes: 100 websites; HTTPS adoption % 99%
HTTPS adoption %: 81.3100

Denominator: websites · n per cohort in the table

View as table
CohortSitesShareHTTPS adoption %
.com430,73843.1%97.9%
.org42,4694.2%98.8%
.net42,4084.2%97.1%
.ru35,6623.6%96.7%
.uk30,2123%99.6%
.de29,3332.9%99.5%
.nl19,9772%99.8%
.br17,6451.8%99.1%
.jp16,3301.6%98.4%
.it11,7651.2%99.4%
.in11,7621.2%98.4%
.fr10,7881.1%99.3%
.pl10,1751%99.4%
.cn9,3600.9%81.3%
.io8,9720.9%99.5%
.au8,2080.8%99.6%
.cc7,3860.7%98.7%
.co7,1310.7%98.7%
.ca6,5640.7%99.2%
.eu5,7930.6%99%
.es5,7630.6%99.3%
.cz5,6930.6%99.1%
.xyz5,3480.5%97.9%
.ua5,1690.5%99%
.id4,9080.5%99.4%
.info4,8880.5%97.8%
.kr4,6090.5%97.5%
.ro4,4830.4%99.4%
.online4,4100.4%97.6%
.us4,2540.4%97.9%
.shop4,1400.4%95.2%
.ch4,0940.4%99.4%
.se3,8540.4%99.6%
.ai3,8170.4%99.6%
.gr3,7630.4%99.6%
.app3,6370.4%99.3%
.be3,5500.4%99.5%
.ar3,3720.3%99.1%
.mx3,3660.3%98.6%
.site3,3060.3%98%
.at3,2830.3%99.2%
.hu3,2670.3%99.2%
.edu3,0790.3%99.7%
.top3,0680.3%96.8%
.tr3,0010.3%98.5%
.me2,9420.3%98.8%
.ir2,8690.3%98.7%
.za2,8050.3%98.9%
.tw2,7550.3%96.8%
.vn2,6900.3%98.7%
.cl2,6860.3%99.6%
.tv2,6630.3%98.4%
.dk2,5920.3%99.3%
.pro2,4830.2%97.2%
.fi2,4310.2%99.6%
.vip2,1460.2%91.1%
.sk2,1380.2%99.7%
.pt2,1350.2%99.3%
.live2,0170.2%98.9%
.no2,0060.2%99.8%
.gov1,9580.2%99.7%
.biz1,9170.2%97.3%
.pk1,7470.2%99.5%
.nz1,6990.2%99.6%
.il1,6510.2%99.2%
.cloud1,5690.2%99.7%
.my1,5540.2%98.4%
.kz1,5160.2%99.3%
.casino1,5050.2%98.1%
.ie1,4540.1%99.5%
.store1,4430.1%98.1%
.club1,3760.1%98.4%
.dev1,3520.1%97.6%
.ph1,3390.1%98.7%
.bg1,3380.1%99.3%
.by1,2840.1%98.9%
.hr1,2100.1%99.8%
.space1,2100.1%97.4%
.pe1,2070.1%98.6%
.lt1,1970.1%99.3%
.tech1,1370.1%97%
.rs1,0890.1%99.4%
.click1,0720.1%98%
.su9360.1%95%
.hk9340.1%98.1%
.th9320.1%98.9%
.fun9230.1%97.7%
.buzz9160.1%97.6%
.lv9030.1%98.7%
.ee8800.1%99.7%
.si8750.1%99.9%
.lol8730.1%96.6%
.sg8580.1%99.4%
.one8540.1%98.7%
.gg8530.1%99.6%
.to8230.1%97.9%
.ae7620.1%99.5%
.win7570.1%98.7%
.ng7230.1%99.7%
.link7110.1%98.9%
.bd7010.1%98.9%
.icu6550.1%98.5%
.uz6330.1%99.4%
.blog6290.1%96.2%
.xn--p1ai5780.1%97.8%
.bet5750.1%99.5%
.az5660.1%99.6%
.life5520.1%99.3%
.mobi5290.1%98.5%
.lk5210.1%99.8%
.sa5190.1%99.2%
.ec5180.1%99.2%
.ke5180.1%99.2%
.games5080.1%98.4%
.ma5040.1%99%
.news5020.1%99.4%
.asia4930%97%
.sbs4880%99%
.uy4860%98.8%
.ge4730%99.2%
.is4690%99.4%
.cfd4490%99.1%
.md4440%99.3%
.cat4410%99.3%
.wiki4340%98.4%
.world4330%99.5%
.network4040%99.5%
.media3950%99.2%
.website3910%97.7%
.work3850%97.7%
.am3720%100%
.art3710%98.7%
.cyou3630%98.6%
.lat3610%97%
.digital3520%98.6%
.ba3470%100%
.ink3450%97.4%
.fm3420%99.1%
.today3220%99.1%
.ws3200%97.5%
.py3050%99.7%
.im3030%99.7%
.team2990%98.7%
.kg2960%100%
.tn2940%97.3%
.nu2920%98.3%
.eg2880%96.9%
.mk2860%98.3%
.do2810%100%
.global2760%98.9%
.lu2680%99.3%
.pw2680%97.8%
.social2680%99.6%
.xxx2630%99.6%
.host2610%100%
.np2580%97.3%
.chat2490%98.4%
.run2450%98.8%
.sh2430%99.6%
.fit2400%99.2%
.cam2390%99.2%
.gt2390%99.6%
.cr2360%99.6%
.name2310%98.3%
.tz2300%99.1%
.video2290%99.1%
.st2270%98.2%
.ve2260%96%
.game2240%100%
.la2180%98.6%
.best2150%97.7%
.travel2130%100%
.bo2020%98%
.cy1970%99.5%
.mom1960%98%
.plus1920%100%
.al1840%99.5%
.guru1840%100%
.group1790%96.6%
.pics1790%98.9%
.zone1790%98.9%
.so1760%98.9%
.monster1740%97.1%
.bz1730%98.3%
.mn1720%97.7%
.moe1610%97.5%
.dz1600%97.5%
.ly1600%98.8%
.help1570%98.1%
.li1570%97.5%
.ac1550%99.4%
.love1540%100%
.tools1500%98.7%
.ug1490%100%
.sv1480%98%
.aero1470%98.6%
.cx1450%97.9%
.re1420%98.6%
.city1410%97.9%
.jo1410%97.9%
.bio1390%99.3%
.services1390%97.1%
.watch1350%98.5%
.qa1340%99.3%
.studio1340%98.5%
.coop1330%100%
.ltd1330%97%
.pa1330%99.2%
.gh1310%99.2%
.eus1300%99.2%
.quest1300%97.7%
.center1260%99.2%
.stream1250%98.4%
.tokyo1240%100%
.baby1230%94.3%
.rest1230%97.6%
.wtf1210%100%
.systems1200%97.5%
.health1190%99.2%
.page1190%100%
.market1160%97.4%
.tube1130%100%
.hn1110%100%
.bond1090%98.2%
.design1080%98.1%
.vc1080%100%
.ag1070%99.1%
.africa1030%100%
.rocks1030%99%
.fans1020%99%
.fyi1010%100%
.iq1010%100%
.vu1010%99%
.zw1010%99%
.homes1000%99%
Other14,7981.5%98.7%

TLS score by TLD

Which TLDs are ahead of or behind the web, measured by SSL Monitor security score

web average = 82.6 pts.gov: 89.4; +6.8 pts vs web average = 82.6 pts (better); n=1945 .gov +6.8 pts.no: 89.3; +6.6 pts vs web average = 82.6 pts (better); n=1994 .no +6.6 pts.fi: 89; +6.4 pts vs web average = 82.6 pts (better); n=2419 .fi +6.4 pts.ai: 88.8; +6.2 pts vs web average = 82.6 pts (better); n=3785 .ai +6.2 pts.dk: 88.6; +6 pts vs web average = 82.6 pts (better); n=2569 .dk +6 pts.de: 88.3; +5.6 pts vs web average = 82.6 pts (better); n=28937 .de +5.6 pts.ch: 88.1; +5.5 pts vs web average = 82.6 pts (better); n=4054 .ch +5.5 pts.edu: 88; +5.3 pts vs web average = 82.6 pts (better); n=3060 .edu +5.3 pts.nz: 87.7; +5.1 pts vs web average = 82.6 pts (better); n=1690 .nz +5.1 pts.at: 87.4; +4.8 pts vs web average = 82.6 pts (better); n=3247 .at +4.8 pts.se: 87.4; +4.7 pts vs web average = 82.6 pts (better); n=3827 .se +4.7 pts.ie: 87.3; +4.7 pts vs web average = 82.6 pts (better); n=1445 .ie +4.7 pts.au: 87.3; +4.7 pts vs web average = 82.6 pts (better); n=8155 .au +4.7 pts.be: 87.2; +4.6 pts vs web average = 82.6 pts (better); n=3524 .be +4.6 pts.ca: 86.8; +4.1 pts vs web average = 82.6 pts (better); n=6497 .ca +4.1 pts.fr: 86.5; +3.9 pts vs web average = 82.6 pts (better); n=10668 .fr +3.9 pts.io: 86.5; +3.8 pts vs web average = 82.6 pts (better); n=8887 .io +3.8 pts.nl: 86.4; +3.8 pts vs web average = 82.6 pts (better); n=19896 .nl +3.8 pts.cz: 86; +3.4 pts vs web average = 82.6 pts (better); n=5615 .cz +3.4 pts.cl: 85.7; +3.1 pts vs web average = 82.6 pts (better); n=2664 .cl +3.1 pts.sk: 85.5; +2.9 pts vs web average = 82.6 pts (better); n=2126 .sk +2.9 pts.ro: 85.3; +2.7 pts vs web average = 82.6 pts (better); n=4446 .ro +2.7 pts.uk: 85.1; +2.5 pts vs web average = 82.6 pts (better); n=30002 .uk +2.5 pts.pt: 84.8; +2.2 pts vs web average = 82.6 pts (better); n=2111 .pt +2.2 pts.org: 84.8; +2.1 pts vs web average = 82.6 pts (better); n=41732 .org +2.1 pts.it: 84.3; +1.7 pts vs web average = 82.6 pts (better); n=11657 .it +1.7 pts.il: 84.3; +1.6 pts vs web average = 82.6 pts (better); n=1635 .il +1.6 pts.rs: 84.2; +1.6 pts vs web average = 82.6 pts (better); n=1080 .rs +1.6 pts.cc: 84.2; +1.5 pts vs web average = 82.6 pts (better); n=7249 .cc +1.5 pts.co: 84.1; +1.4 pts vs web average = 82.6 pts (better); n=7001 .co +1.4 pts.pe: 84.1; +1.4 pts vs web average = 82.6 pts (better); n=1186 .pe +1.4 pts.app: 84.1; +1.4 pts vs web average = 82.6 pts (better); n=3589 .app +1.4 pts.gr: 84; +1.4 pts vs web average = 82.6 pts (better); n=3742 .gr +1.4 pts.store: 84; +1.3 pts vs web average = 82.6 pts (better); n=1394 .store +1.3 pts.us: 83.9; +1.3 pts vs web average = 82.6 pts (better); n=4139 .us +1.3 pts.hr: 83.9; +1.3 pts vs web average = 82.6 pts (better); n=1205 .hr +1.3 pts.br: 83.8; +1.2 pts vs web average = 82.6 pts (better); n=17388 .br +1.2 pts.za: 83.8; +1.2 pts vs web average = 82.6 pts (better); n=2761 .za +1.2 pts.pk: 83.8; +1.1 pts vs web average = 82.6 pts (better); n=1735 .pk +1.1 pts.dev: 83.6; +1 pts vs web average = 82.6 pts (better); n=1307 .dev +1 pts.eu: 83.5; +0.9 pts vs web average = 82.6 pts (better); n=5699 .eu +0.9 pts.com: 83.2; +0.5 pts vs web average = 82.6 pts (better); n=418198 .com +0.5 pts.jp: 82.8; +0.2 pts vs web average = 82.6 pts (better); n=15961 .jp +0.2 pts.ar: 82.7; +0.1 pts vs web average = 82.6 pts (better); n=3308 .ar +0.1 pts.lt: 82.6; −0 pts vs web average = 82.6 pts (worse); n=1183 .lt −0 pts.es: 82.6; −0 pts vs web average = 82.6 pts (worse); n=5699 .es −0 pts.ph: 82.5; −0.1 pts vs web average = 82.6 pts (worse); n=1315 .ph −0.1 pts.mx: 82.4; −0.2 pts vs web average = 82.6 pts (worse); n=3297 .mx −0.2 ptsOther: 82.3; −0.3 pts vs web average = 82.6 pts (worse); n=14485 Other −0.3 pts.bg: 82.2; −0.4 pts vs web average = 82.6 pts (worse); n=1326 .bg −0.4 pts.me: 82.1; −0.5 pts vs web average = 82.6 pts (worse); n=2889 .me −0.5 pts.by: 81.9; −0.7 pts vs web average = 82.6 pts (worse); n=1270 .by −0.7 pts.in: 81.7; −0.9 pts vs web average = 82.6 pts (worse); n=11521 .in −0.9 pts.cloud: 81.6; −1 pts vs web average = 82.6 pts (worse); n=1560 .cloud −1 pts.hu: 81.6; −1.1 pts vs web average = 82.6 pts (worse); n=3227 .hu −1.1 pts.tv: 81.5; −1.1 pts vs web average = 82.6 pts (worse); n=2609 .tv −1.1 pts.ua: 81.5; −1.1 pts vs web average = 82.6 pts (worse); n=5091 .ua −1.1 pts.id: 81.1; −1.5 pts vs web average = 82.6 pts (worse); n=4864 .id −1.5 pts.tr: 81.1; −1.5 pts vs web average = 82.6 pts (worse); n=2951 .tr −1.5 pts.kz: 80.9; −1.7 pts vs web average = 82.6 pts (worse); n=1504 .kz −1.7 pts.my: 80.9; −1.7 pts vs web average = 82.6 pts (worse); n=1521 .my −1.7 pts.club: 80.6; −2.1 pts vs web average = 82.6 pts (worse); n=1338 .club −2.1 pts.pl: 80.3; −2.4 pts vs web average = 82.6 pts (worse); n=10086 .pl −2.4 pts.vip: 79.5; −3.1 pts vs web average = 82.6 pts (worse); n=1939 .vip −3.1 pts.tech: 79.3; −3.3 pts vs web average = 82.6 pts (worse); n=1088 .tech −3.3 pts.net: 78.8; −3.8 pts vs web average = 82.6 pts (worse); n=40661 .net −3.8 pts.info: 78.8; −3.9 pts vs web average = 82.6 pts (worse); n=4726 .info −3.9 pts.pro: 78.2; −4.5 pts vs web average = 82.6 pts (worse); n=2382 .pro −4.5 pts.vn: 78; −4.6 pts vs web average = 82.6 pts (worse); n=2640 .vn −4.6 pts.live: 77.7; −5 pts vs web average = 82.6 pts (worse); n=1986 .live −5 pts.xyz: 77.2; −5.4 pts vs web average = 82.6 pts (worse); n=5166 .xyz −5.4 pts.online: 77.1; −5.6 pts vs web average = 82.6 pts (worse); n=4239 .online −5.6 pts.site: 77; −5.6 pts vs web average = 82.6 pts (worse); n=3202 .site −5.6 pts.tw: 77; −5.6 pts vs web average = 82.6 pts (worse); n=2634 .tw −5.6 pts.biz: 76.9; −5.8 pts vs web average = 82.6 pts (worse); n=1727 .biz −5.8 pts.space: 76.5; −6.2 pts vs web average = 82.6 pts (worse); n=1153 .space −6.2 pts.click: 76; −6.6 pts vs web average = 82.6 pts (worse); n=1037 .click −6.6 pts.ru: 76; −6.6 pts vs web average = 82.6 pts (worse); n=33826 .ru −6.6 pts.ir: 76; −6.6 pts vs web average = 82.6 pts (worse); n=2818 .ir −6.6 pts.top: 72.7; −9.9 pts vs web average = 82.6 pts (worse); n=2916 .top −9.9 pts.shop: 71.6; −11 pts vs web average = 82.6 pts (worse); n=3905 .shop −11 pts.kr: 66.8; −15.8 pts vs web average = 82.6 pts (worse); n=4427 .kr −15.8 pts.casino: 62.1; −20.6 pts vs web average = 82.6 pts (worse); n=1357 .casino −20.6 pts.cn: 59.1; −23.6 pts vs web average = 82.6 pts (worse); n=7187 .cn −23.6 pts
Better than benchmarkWorse than benchmark

Denominator: deep-scanned websites · n per cohort in the table

View as table
SliceAverage scorevs benchmarkn
.gov89.4 pts+6.8 pts1,945
.no89.3 pts+6.6 pts1,994
.fi89 pts+6.4 pts2,419
.ai88.8 pts+6.2 pts3,785
.dk88.6 pts+6 pts2,569
.de88.3 pts+5.6 pts28,937
.ch88.1 pts+5.5 pts4,054
.edu88 pts+5.3 pts3,060
.nz87.7 pts+5.1 pts1,690
.at87.4 pts+4.8 pts3,247
.se87.4 pts+4.7 pts3,827
.ie87.3 pts+4.7 pts1,445
.au87.3 pts+4.7 pts8,155
.be87.2 pts+4.6 pts3,524
.ca86.8 pts+4.1 pts6,497
.fr86.5 pts+3.9 pts10,668
.io86.5 pts+3.8 pts8,887
.nl86.4 pts+3.8 pts19,896
.cz86 pts+3.4 pts5,615
.cl85.7 pts+3.1 pts2,664
.sk85.5 pts+2.9 pts2,126
.ro85.3 pts+2.7 pts4,446
.uk85.1 pts+2.5 pts30,002
.pt84.8 pts+2.2 pts2,111
.org84.8 pts+2.1 pts41,732
.it84.3 pts+1.7 pts11,657
.il84.3 pts+1.6 pts1,635
.rs84.2 pts+1.6 pts1,080
.cc84.2 pts+1.5 pts7,249
.co84.1 pts+1.4 pts7,001
.pe84.1 pts+1.4 pts1,186
.app84.1 pts+1.4 pts3,589
.gr84 pts+1.4 pts3,742
.store84 pts+1.3 pts1,394
.us83.9 pts+1.3 pts4,139
.hr83.9 pts+1.3 pts1,205
.br83.8 pts+1.2 pts17,388
.za83.8 pts+1.2 pts2,761
.pk83.8 pts+1.1 pts1,735
.dev83.6 pts+1 pts1,307
.eu83.5 pts+0.9 pts5,699
.com83.2 pts+0.5 pts418,198
.jp82.8 pts+0.2 pts15,961
.ar82.7 pts+0.1 pts3,308
.lt82.6 pts−0 pts1,183
.es82.6 pts−0 pts5,699
.ph82.5 pts−0.1 pts1,315
.mx82.4 pts−0.2 pts3,297
Other82.3 pts−0.3 pts14,485
.bg82.2 pts−0.4 pts1,326
.me82.1 pts−0.5 pts2,889
.by81.9 pts−0.7 pts1,270
.in81.7 pts−0.9 pts11,521
.cloud81.6 pts−1 pts1,560
.hu81.6 pts−1.1 pts3,227
.tv81.5 pts−1.1 pts2,609
.ua81.5 pts−1.1 pts5,091
.id81.1 pts−1.5 pts4,864
.tr81.1 pts−1.5 pts2,951
.kz80.9 pts−1.7 pts1,504
.my80.9 pts−1.7 pts1,521
.club80.6 pts−2.1 pts1,338
.pl80.3 pts−2.4 pts10,086
.vip79.5 pts−3.1 pts1,939
.tech79.3 pts−3.3 pts1,088
.net78.8 pts−3.8 pts40,661
.info78.8 pts−3.9 pts4,726
.pro78.2 pts−4.5 pts2,382
.vn78 pts−4.6 pts2,640
.live77.7 pts−5 pts1,986
.xyz77.2 pts−5.4 pts5,166
.online77.1 pts−5.6 pts4,239
.site77 pts−5.6 pts3,202
.tw77 pts−5.6 pts2,634
.biz76.9 pts−5.8 pts1,727
.space76.5 pts−6.2 pts1,153
.click76 pts−6.6 pts1,037
.ru76 pts−6.6 pts33,826
.ir76 pts−6.6 pts2,818
.top72.7 pts−9.9 pts2,916
.shop71.6 pts−11 pts3,905
.kr66.8 pts−15.8 pts4,427
.casino62.1 pts−20.6 pts1,357
.cn59.1 pts−23.6 pts7,187
Government cohorts

.gov, .edu and the public sector

Not affected by the filter above.

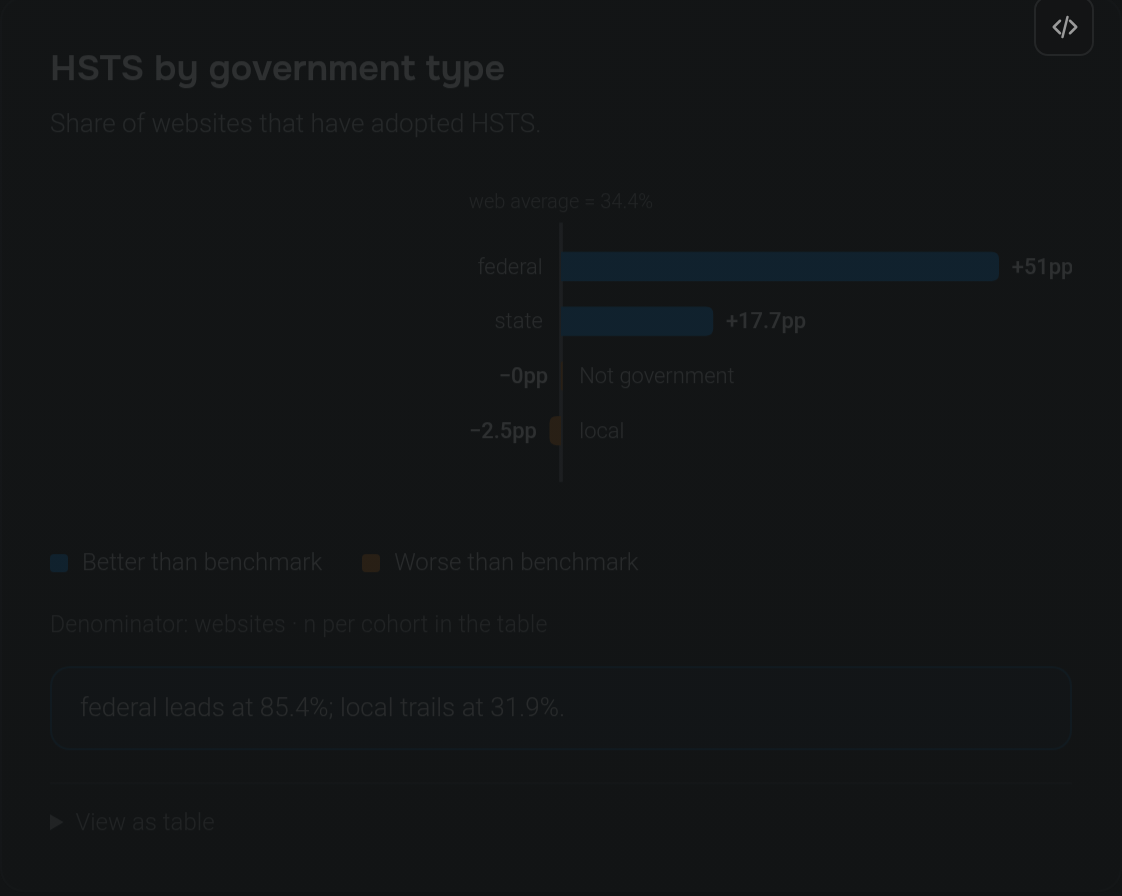
HSTS by government type

Share of websites that have adopted HSTS.

web average = 34.4%federal: 85.4; +51pp vs web average = 34.4% (better); n=534 federal +51ppstate: 52.1; +17.7pp vs web average = 34.4% (better); n=330 state +17.7ppNot government: 34.4; −0pp vs web average = 34.4% (worse); n=998061 Not government −0pplocal: 31.9; −2.5pp vs web average = 34.4% (worse); n=1061 local −2.5pp
Better than benchmarkWorse than benchmark

Denominator: websites · n per cohort in the table

federal leads at 85.4%; local trails at 31.9%.

View as table
SliceSharevs benchmarkn
federal85.4%+51pp534
state52.1%+17.7pp330
Not government34.4%−0pp998,061
local31.9%−2.5pp1,061

TLS 1.0 by government type

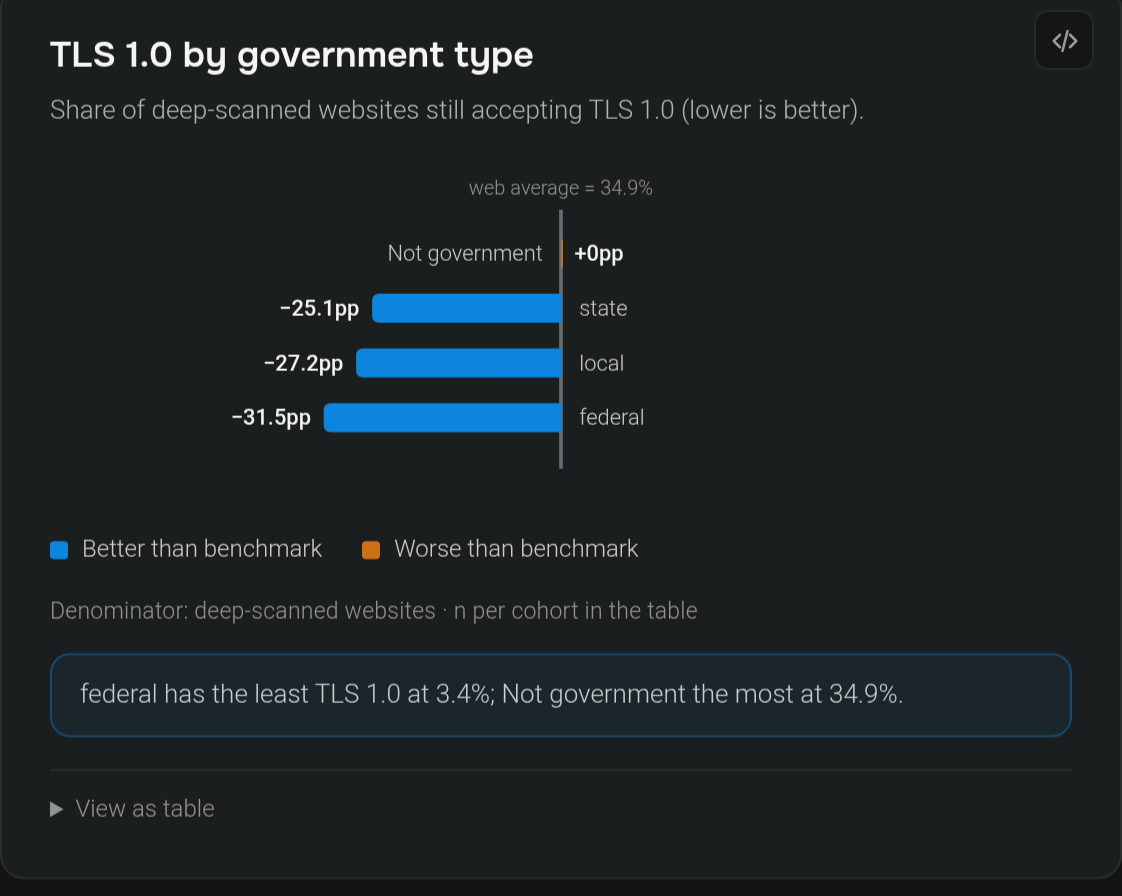
Share of deep-scanned websites still accepting TLS 1.0 (lower is better).

web average = 34.9%Not government: 34.9; +0pp vs web average = 34.9% (worse); n=971515 Not government +0ppstate: 9.8; −25.1pp vs web average = 34.9% (better); n=326 state −25.1pplocal: 7.7; −27.2pp vs web average = 34.9% (better); n=1055 local −27.2ppfederal: 3.4; −31.5pp vs web average = 34.9% (better); n=531 federal −31.5pp
Better than benchmarkWorse than benchmark

Denominator: deep-scanned websites · n per cohort in the table

federal has the least TLS 1.0 at 3.4%; Not government the most at 34.9%.

View as table
SliceSharevs benchmarkn
Not government34.9%+0pp971,515
state9.8%−25.1pp326
local7.7%−27.2pp1,055
federal3.4%−31.5pp531
Loading...